

Capture the Energy of Strategic Decision-Making
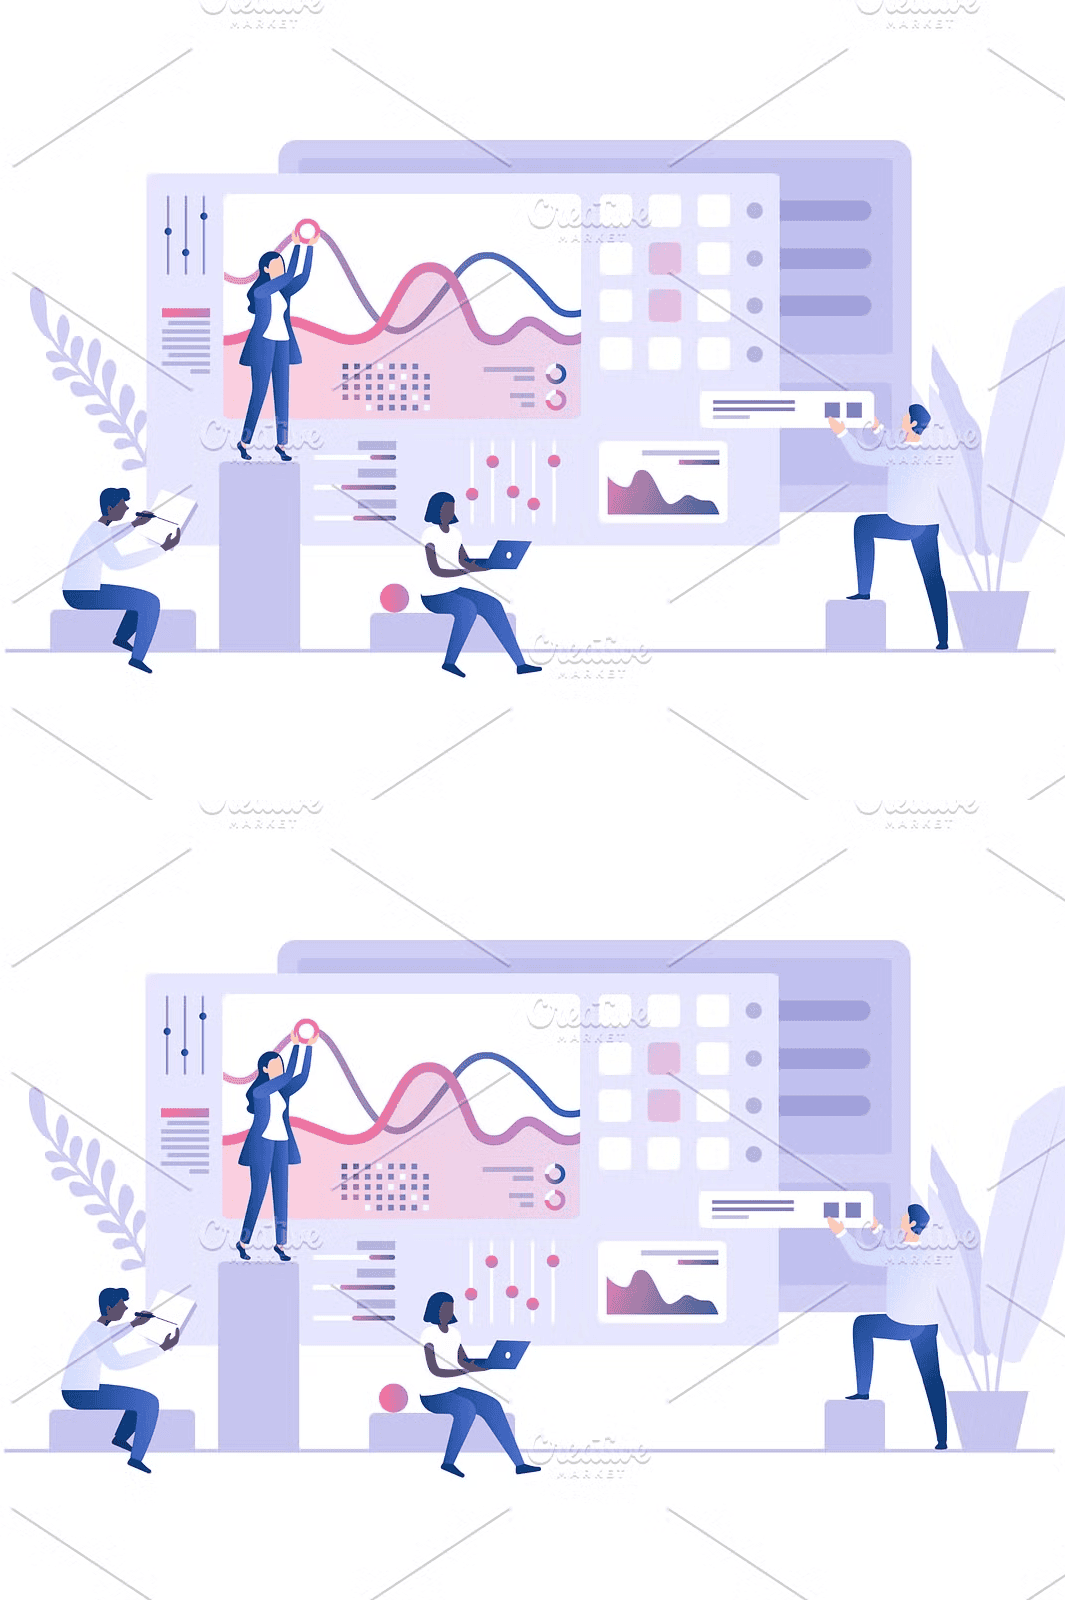
Bring your data-driven narrative to life with a vibrant, high-detail illustration of professionals immersed in real-time analysis. This dynamic scene shows multiple individuals engaged in evaluating complex charts, graphs, and market trends—symbolizing collaboration, critical thinking, and informed strategy. Whether you’re presenting financial forecasts, showcasing web analytics, or explaining statistical models, this image instantly conveys expertise, precision, and the power of evidence-based choices.
The composition features a modern, sleek workspace with digital dashboards, interactive data panels, and layered visualizations. Each person is shown in an active, focused posture—pointing at charts, discussing insights, and adjusting parameters. The 3D depth enhances realism, making the scene feel alive and present. It’s not just a background; it’s a statement of intelligence, innovation, and forward-moving business culture.
Professional-Grade Design for Immediate Use
This illustration is engineered for high-impact results across diverse platforms:
– **EPS File**: Fully editable vector format for maximum flexibility in Adobe Illustrator, CorelDRAW, or similar tools—ideal for customization, resizing, or integration into brand assets.
– **High-Resolution JPEG**: 300 DPI output for crisp print quality and clear digital display—perfect for websites, presentations, and social media content.
– **RGB Color Space**: Ensures accurate, bright colors across screens and online environments.
– **Clean, Organized Layers**: Facilitates easy adjustments to the background, data visuals, or character elements—allowing you to tailor the image to fit any specific need.
Use this template to visualize anything from startup growth analytics to enterprise-level market research, all with a consistent, premium feel.
Amplify Your Content with a Relatable, Realistic Narrative
This illustration goes beyond generic stock imagery. It tells a story of teamwork, insight, and the intellectual power behind data. It represents the core of modern business: turning raw numbers into actionable strategies through collaboration and analytical rigor.
Ideal for:
– Financial analysis and investment reporting
– E-commerce performance dashboards and KPI tracking
– Digital marketing agencies showcasing campaign results
– Business schools and corporate training modules on data literacy
– Tech blogs and SaaS content on analytics platforms
Let your visuals reflect the intelligence, discipline, and synergy of a high-performing data team.
Customize Your Visuals to Match Your Brand
You’re not locked into a fixed design. The layered structure empowers you to:
– Change the data types (e.g., shift from sales charts to user engagement metrics)
– Alter the background to fit your brand’s aesthetic
– Adjust character poses or outfits to match your industry
– Use individual elements as standalone icons or animated components
This is not just a single image—it’s a content toolkit for consistent, professional communication across multiple projects.
Lead With Confidence Using a Visual That Speaks Volumes
Your audience notices detail. They respond to authenticity. This illustration doesn’t just show people looking at data—it shows them *understanding* it, *debating* it, and *acting* on it. It positions your content as serious, insightful, and deeply connected to real-world decision-making.
From pitch decks to infographics, from blog headers to landing pages, this image becomes the cornerstone of your message—transforming abstract concepts into tangible, compelling visuals.


Leave a Comment