
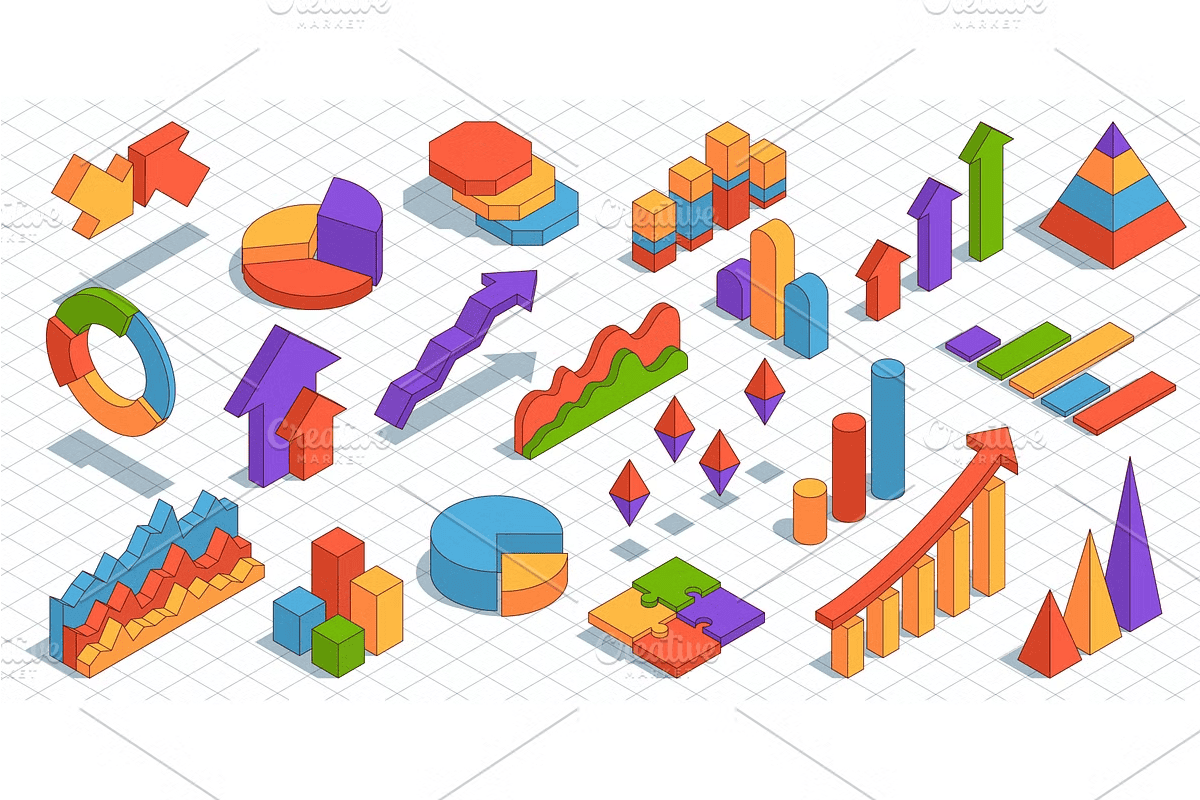
Transform Complex Data into Bold, Engaging Visual Stories
Stop relying on flat, outdated charts that fail to capture attention. With this vibrant **isometric business infographics set**, you gain access to a powerful collection of modern, visually striking data elements designed to make your presentations unforgettable. From colorful pie charts and bar graphs to pyramid structures and dynamic arrow indicators, every component is engineered for clarity, impact, and visual sophistication.
These infographics are not just decorative—they’re strategic tools. The isometric perspective adds depth and realism, making your data feel more tangible and professional. Whether you’re pitching to executives, reporting quarterly results, or creating digital content, these assets help you communicate complex information with precision and flair.
Key Elements for Professional-Grade Presentations
This comprehensive vector set delivers:
– **Diverse Chart Variants**: Pie charts, bar graphs, line diagrams, and stacked charts in clean, modern styles
– **Isometric Design Language**: 3D-like depth enhances visual interest and professional appeal
– **Colorful & Cohesive Palette**: Vibrant yet balanced colors for maximum readability and aesthetic harmony
– **Infographic Elements**: Pyramids for hierarchy, directional arrows for progression, and milestone markers
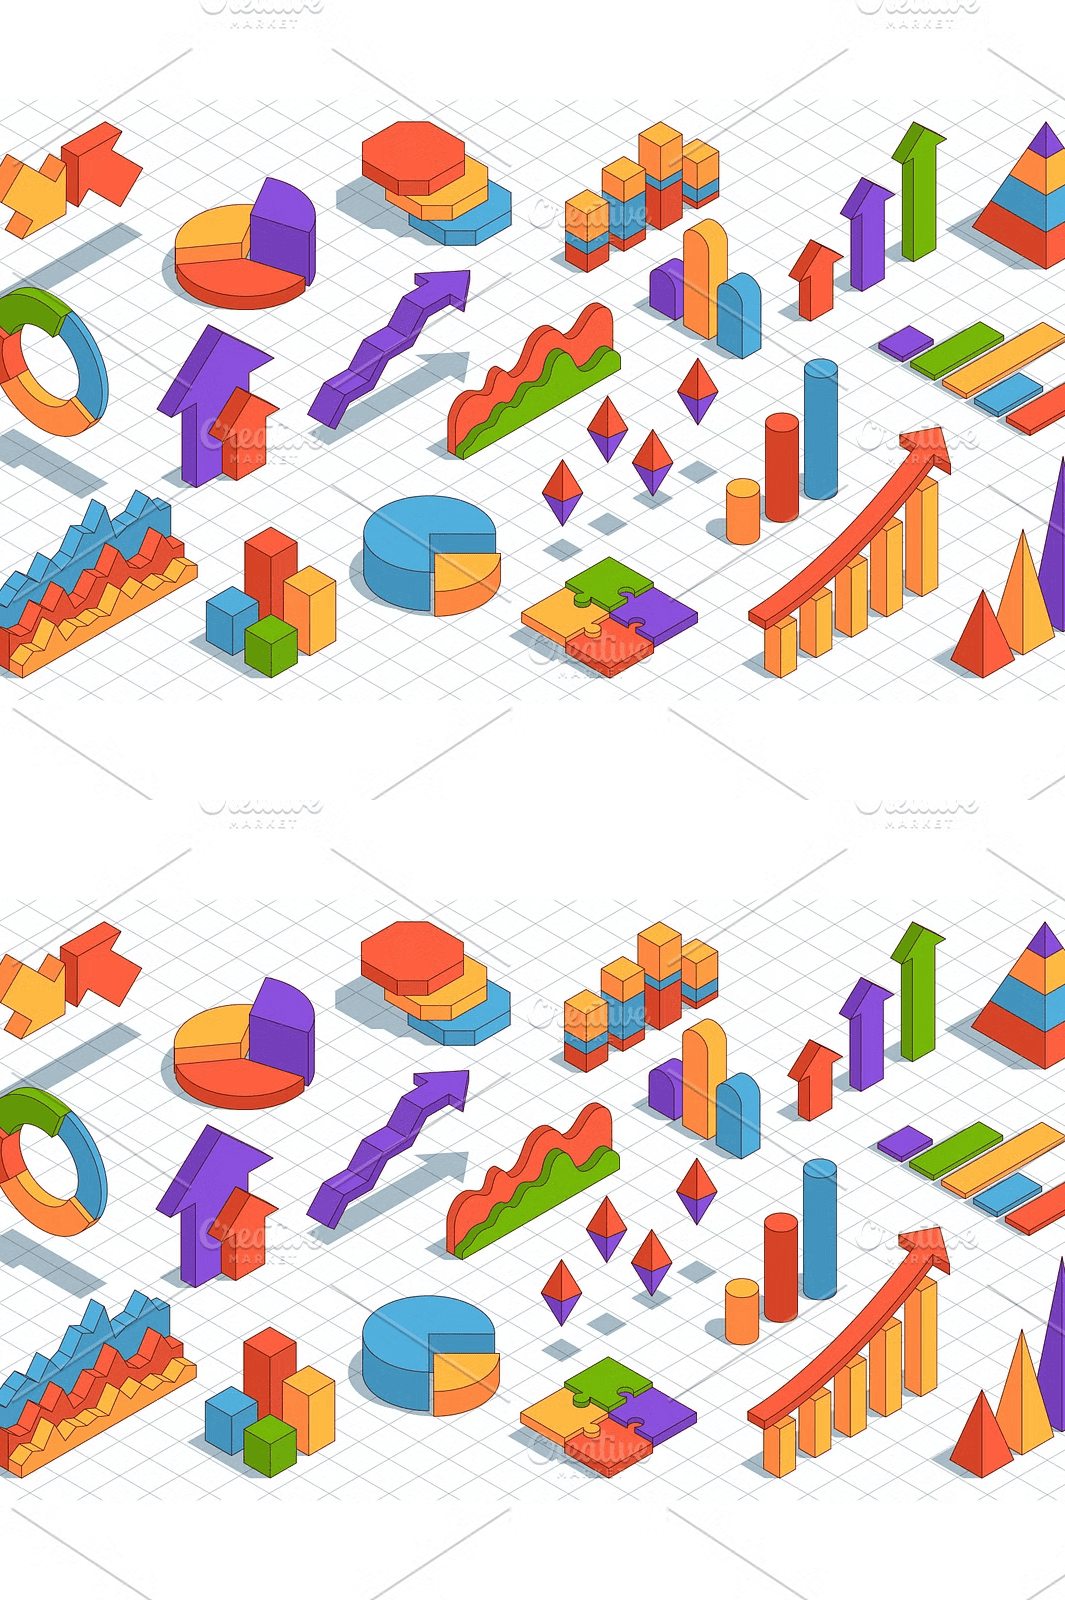
– **Fully Isolated Backgrounds**: No background distractions—perfect for seamless integration into presentations, websites, or reports
– **High-Resolution Vector Files**: Editable in Illustrator, Figma, Canva, and other design tools with infinite scalability
– **Industry-Ready**: Ideal for startups, consultants, marketers, educators, and corporate teams
Each graphic is crafted with attention to detail, ensuring your data tells a compelling story without overwhelming the viewer.
Supercharge Your Reports, Pitches, and Campaigns
Why settle for generic templates when you can stand out with premium, custom-ready visuals? This infographics set empowers you to:
– Create **impactful investor pitch decks** that impress and inform
– Build **professional financial reports** with dynamic data storytelling
– Design **corporate training materials** that enhance engagement
– Develop **social media graphics** and digital content that stop the scroll
– Enhance **website landing pages** with eye-catching stats and visual proof points
– Prepare **educational materials** with clear, intuitive data representation
Use the pyramid diagrams to show growth stages, arrows to illustrate pathways or trends, and colorful graphs to highlight key performance metrics—every element works together to deliver a cohesive, professional narrative.
Seamless Integration Across All Design Platforms
Designed for real-world workflows, this set works flawlessly across your favorite tools:
– **Adobe Illustrator & InDesign**: Ideal for print and high-end digital layouts
– **Figma & Sketch**: Perfect for collaborative UI/UX design and interactive prototypes
– **Canva & PowerPoint**: Easily import and customize for instant presentation upgrades
– **Web & Mobile Development**: Export as SVGs or PNGs for use in dashboards, apps, and websites
– **Animation Projects**: Use individual frames to create smooth data transitions
You can adjust colors, resize elements, change text labels, or combine visuals to represent custom data flows—all without losing quality.
Establish Credibility with High-End Visual Communication
First impressions are visual. Using generic, low-quality icons or outdated chart styles sends a message of indifference. In contrast, these modern isometric graphics signal credibility, innovation, and sharp attention to detail. They show that you value clarity, efficiency, and professional communication.
Use this set to turn data into drama, numbers into narratives, and presentations into performances. Make your insights impossible to ignore.
Don’t waste time designing from scratch. Unlock instant visual impact with a complete, ready-to-use collection built for today’s business world.


Leave a Comment