
Master Visual Storytelling with Professional-Grade Financial Illustrations
Unlock the full power of visual communication with this **high-quality vector set of infographics and infocharts** designed specifically for financial strategy presentations. Crafted in a clean, modern flat style, these icons bring complex ideas to life with precision, elegance, and clarity—perfect for business analysts, educators, startup founders, and marketing teams.
Each graphic is engineered to simplify difficult financial concepts, turning abstract ideas like budgeting, investment growth, risk assessment, and cash flow into intuitive visual narratives. Whether you’re building a business pitch, designing a training module, or creating client reports, these tools ensure your message is not only seen—but deeply understood.
Sophisticated Design, Clear Communication
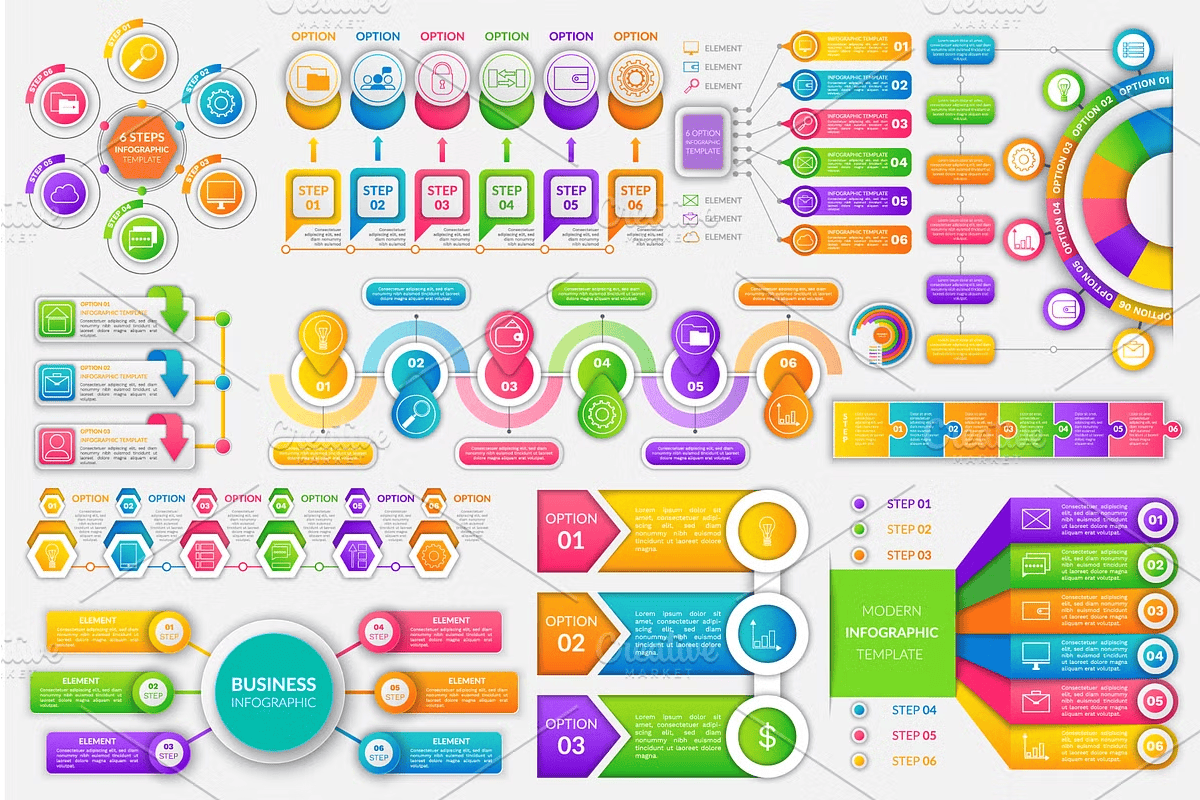
This collection features a cohesive visual language centered on **circular diagrams and step-by-step flow schematics**. The use of concentric circles, directional connectors, and modular layouts creates a natural visual hierarchy that guides the viewer’s eye through financial processes such as:
– Financial planning cycles
– Investment decision trees
– Revenue breakdown models
– Cost-saving strategies
– Budget allocation frameworks
The **wallet with money iconography** is not just decorative—it’s a core component of the visualization toolkit, representing assets, liabilities, and financial health at a glance. Every shape, color, and line is optimized for readability and scalability, ensuring crisp visuals at any size—from small screen displays to large-format print.
Elevate Your Business Presentations with Purposeful Graphics
Stop relying on generic clipart that distracts or confuses your audience. Choose tools built for impact, precision, and professional credibility.
Use these infographics to:
– Visualize complex financial strategies in boardroom presentations
– Simplify economic forecasting for internal reports and client proposals
– Enhance e-learning modules and corporate training content
– Create compelling content for social media, websites, and digital newsletters
– Map out financial milestones in startup pitch decks
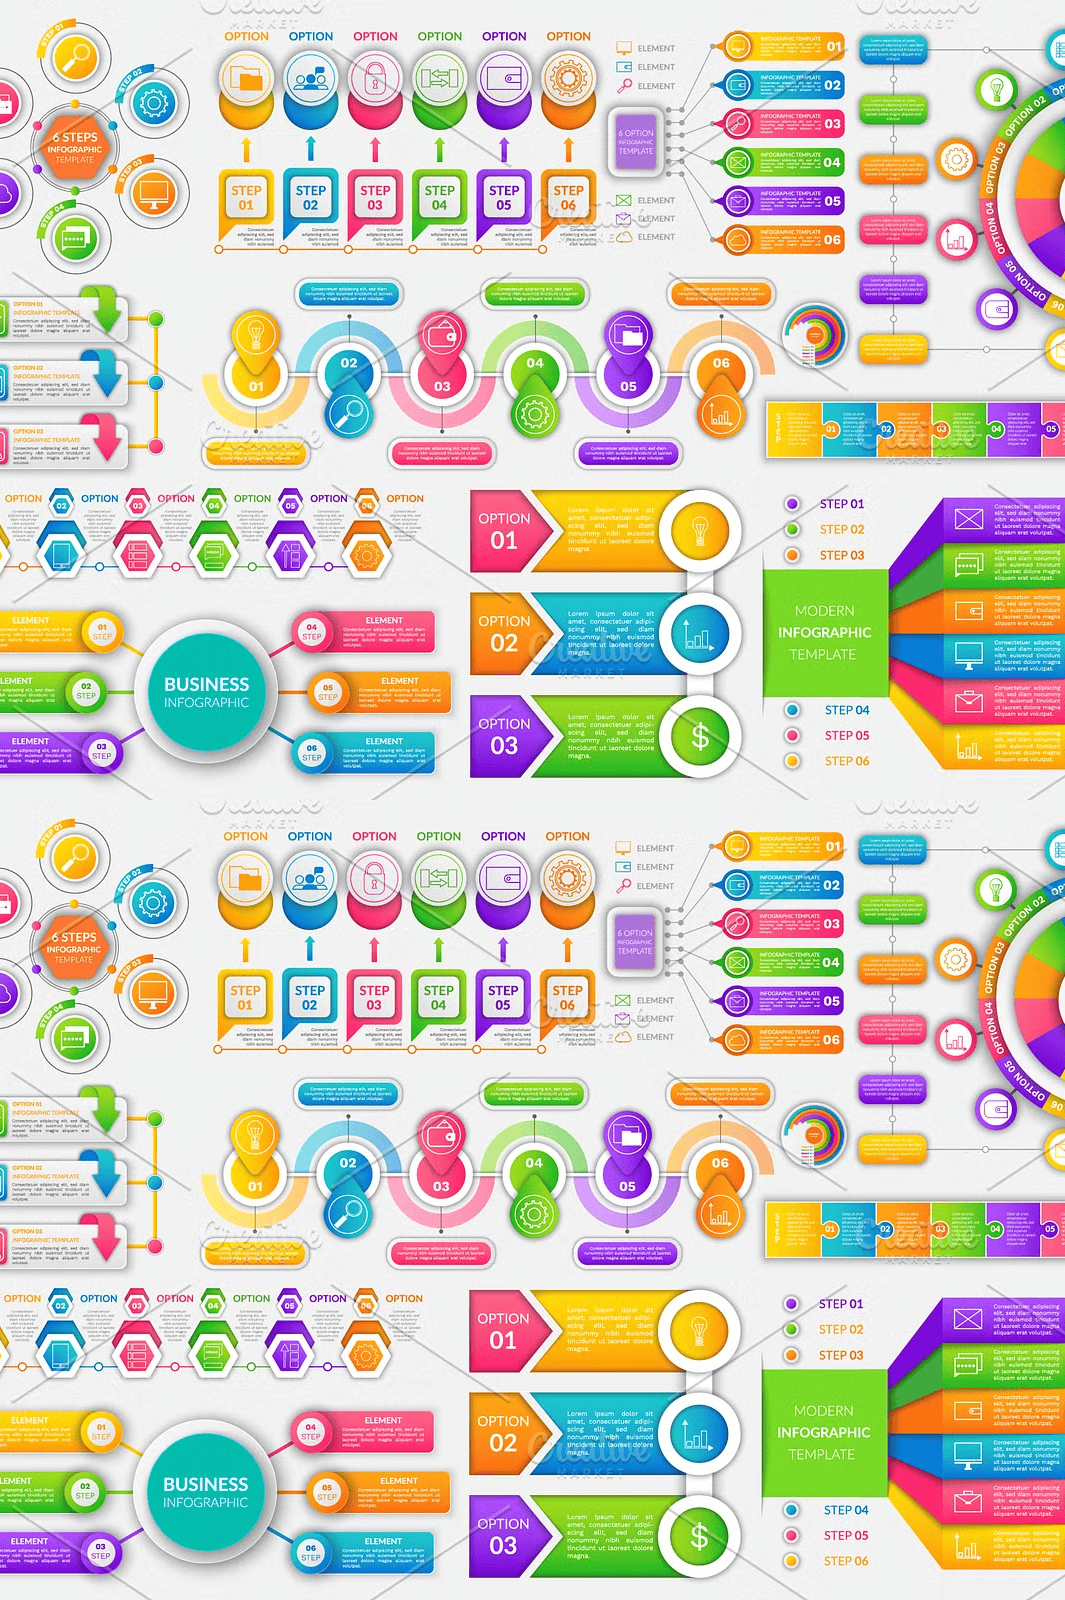
The **flat vector style** ensures that your visuals stay modern, accessible, and free from outdated design trends—making your content instantly credible and visually aligned with today’s top-tier branding standards.
Seamless Integration Across All Platforms
This set is engineered for maximum versatility and instant usability:
– **Multiple file formats included**: SVG, EPS, AI, PDF, and PNG (transparent background)
– **Fully scalable vector graphics**—perfect for high-resolution displays, print, and web use
– **Easy to customize**: Edit colors, add text, or reposition elements in Adobe Illustrator, Figma, or Canva
– **Consistent design language**—elements match perfectly in style, scale, and spacing
– **Well-organized layers and names**—no more hunting through messy files
Whether you’re creating a one-page overview or a full-length strategic report, all assets are structured for efficiency and creativity.
Build Trust and Clarity in Every Financial Communication
In today’s information-rich world, clarity is power. These infographics do more than decorate—they **guide decision-making, reduce misunderstanding, and strengthen trust** between you and your audience.
When investors see a well-designed investment flowchart, they feel confident. When clients view a clear budget model, they understand your proposals better. When employees see a cash flow visualization, they grasp the company’s financial health instantly.
This isn’t just about aesthetics—it’s about **strategic communication**.
Professional Results, Designed for Real-World Use
Ideal for:
– Financial consultants and advisors
– Education and e-learning content creators
– Digital marketers focused on finance topics
– Business coaches and team trainers
– Freelancers and agency designers presenting to clients
Use the **finance idea schemes** to break down complex cycles into digestible visuals that drive action.
Download Your Strategic Visual Toolkit Now
Stop using outdated or confusing visuals. Equip yourself with the tools that make financial strategy *seeable*, *understandable*, and *actionable*.
Transform your next report into a standout success with this elegant, functional, and powerful infographic set.
Click the button to instantly access and start using these powerful tools in your next project. Your audience will thank you for the clarity.


Leave a Comment