
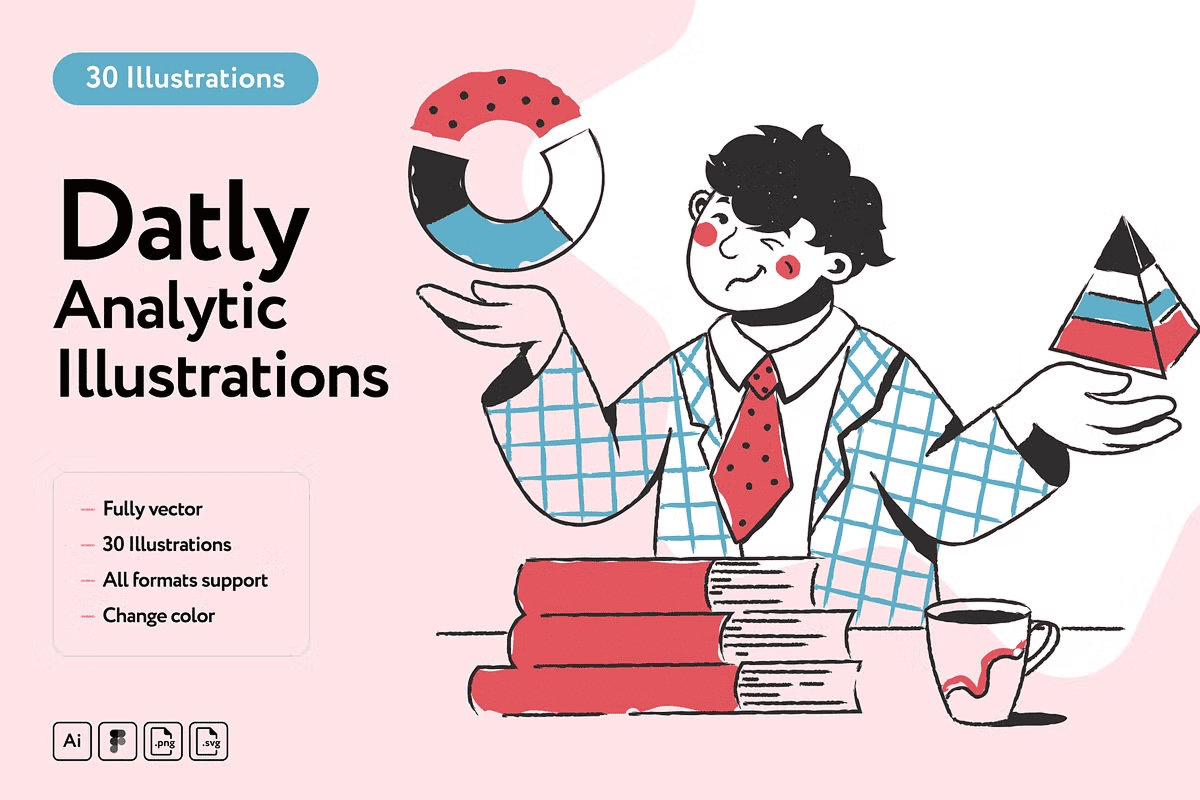
Elevate Your Data Presentations with Bold, Retro-Themed Visuals
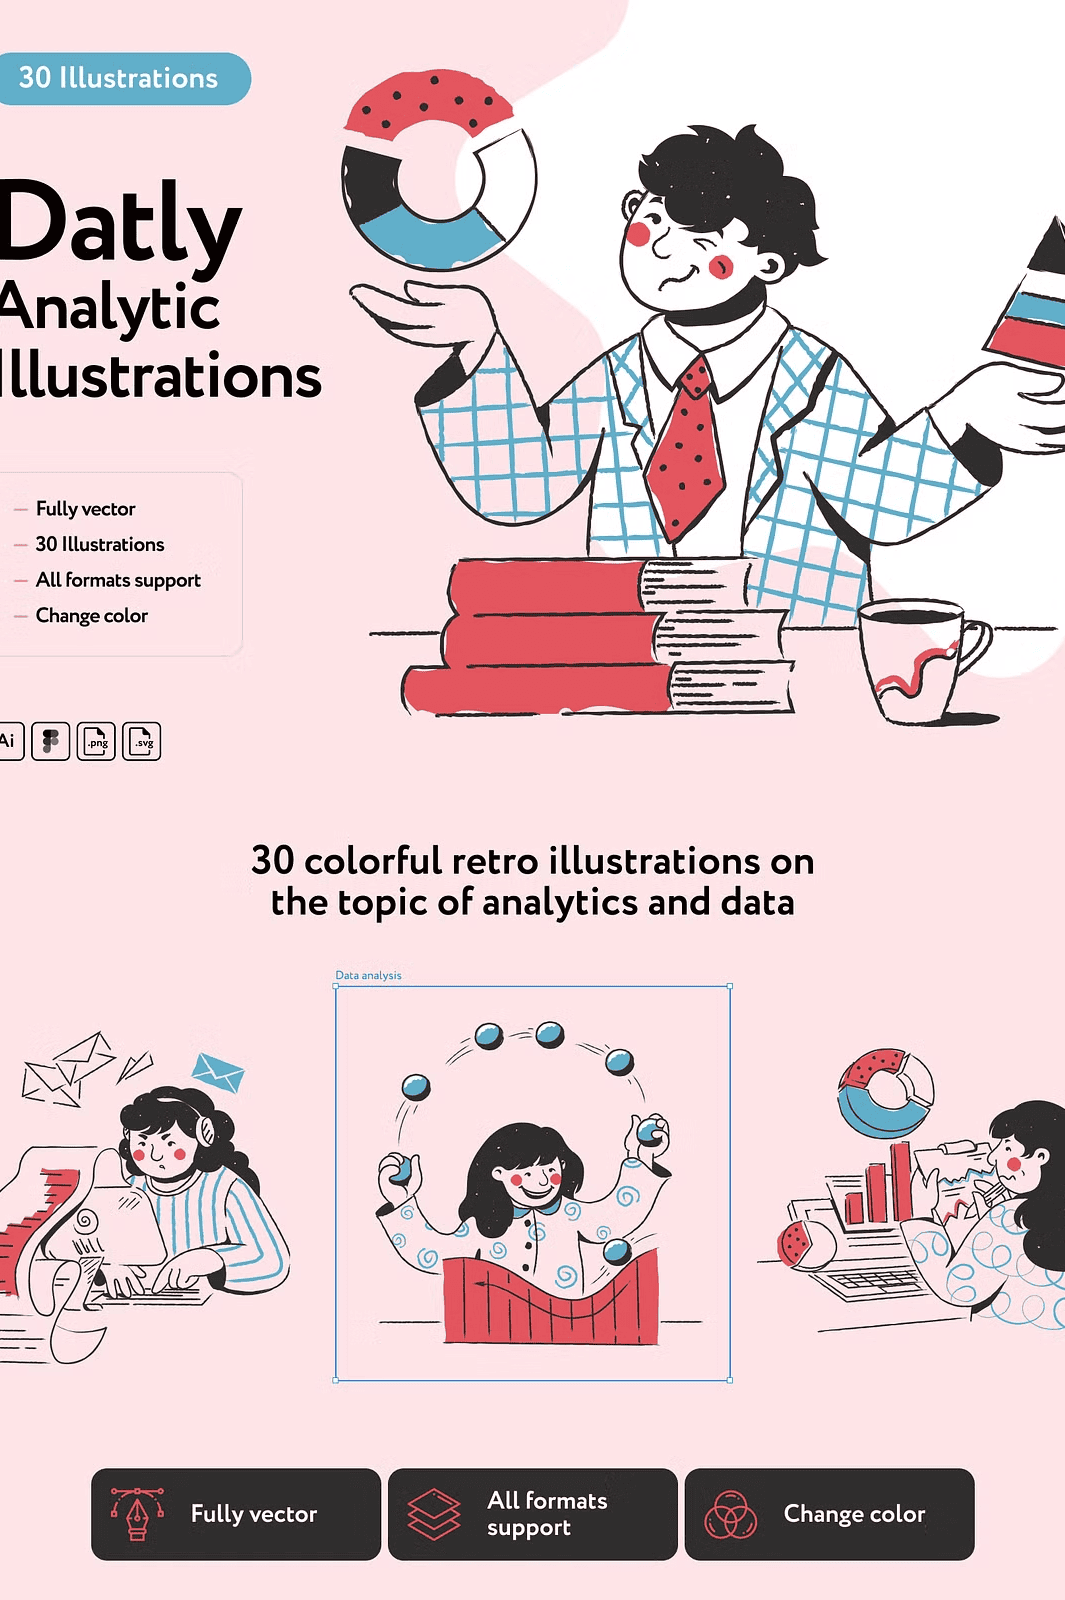
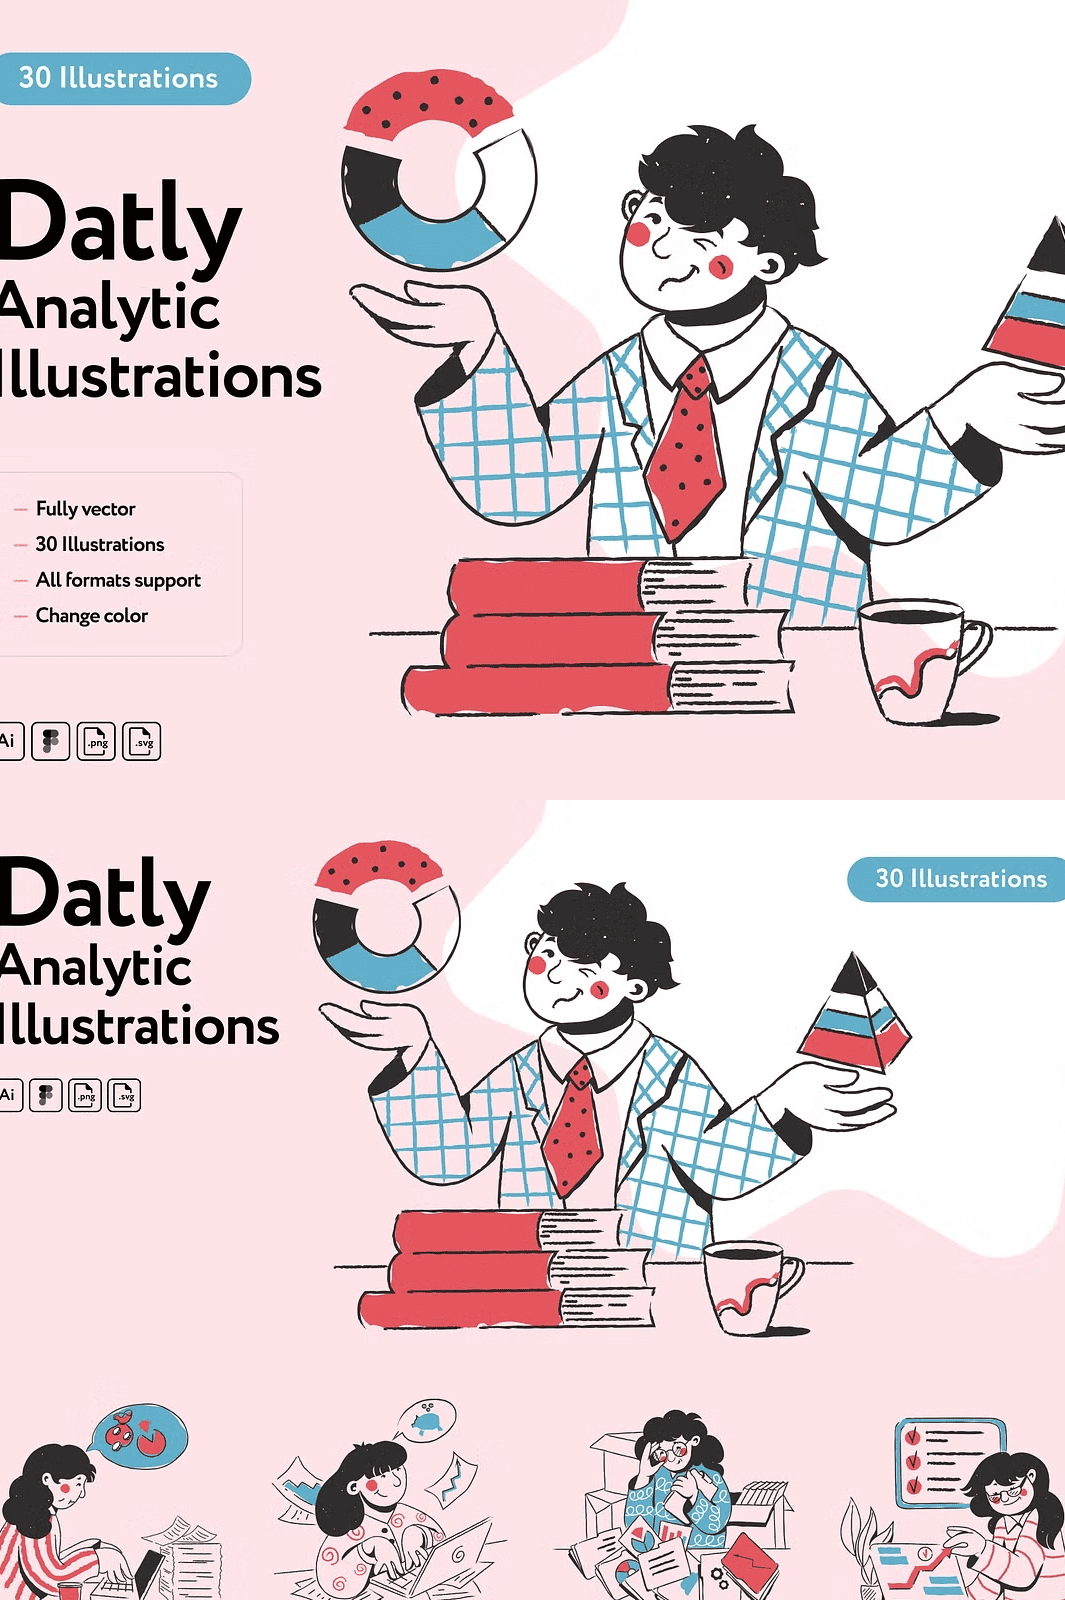
Ignite your creative edge with this striking collection of **30 colorful retro-style analytic illustrations** designed to make data engagement impossible to ignore. Whether you’re crafting a high-impact business presentation, building a dynamic financial dashboard, or developing a modern web or mobile app, these illustrations deliver instant visual appeal and narrative clarity. With a bold color palette, playful yet professional styling, and a distinctly retro vibe, these graphics bring energy and memorability to any data-driven project.
Perfect for designers and developers who crave both style and substance, this set helps you communicate complex analytics with flair. Use them to:
– Illustrate data flows, KPI tracking, and business intelligence dashboards
– Enhance fintech and startup websites with dynamic visual storytelling
– Design engaging social media graphics and marketing content around data insights
– Build interactive app interfaces that visualize user growth, metrics, and trends
– Create compelling educational content for courses, blogs, or internal reports
These illustrations are not just decorative—they’re strategic tools for simplifying complexity and guiding your audience through data with confidence and fun.
Design with Speed and Freedom Using Fully Editable Vector Files
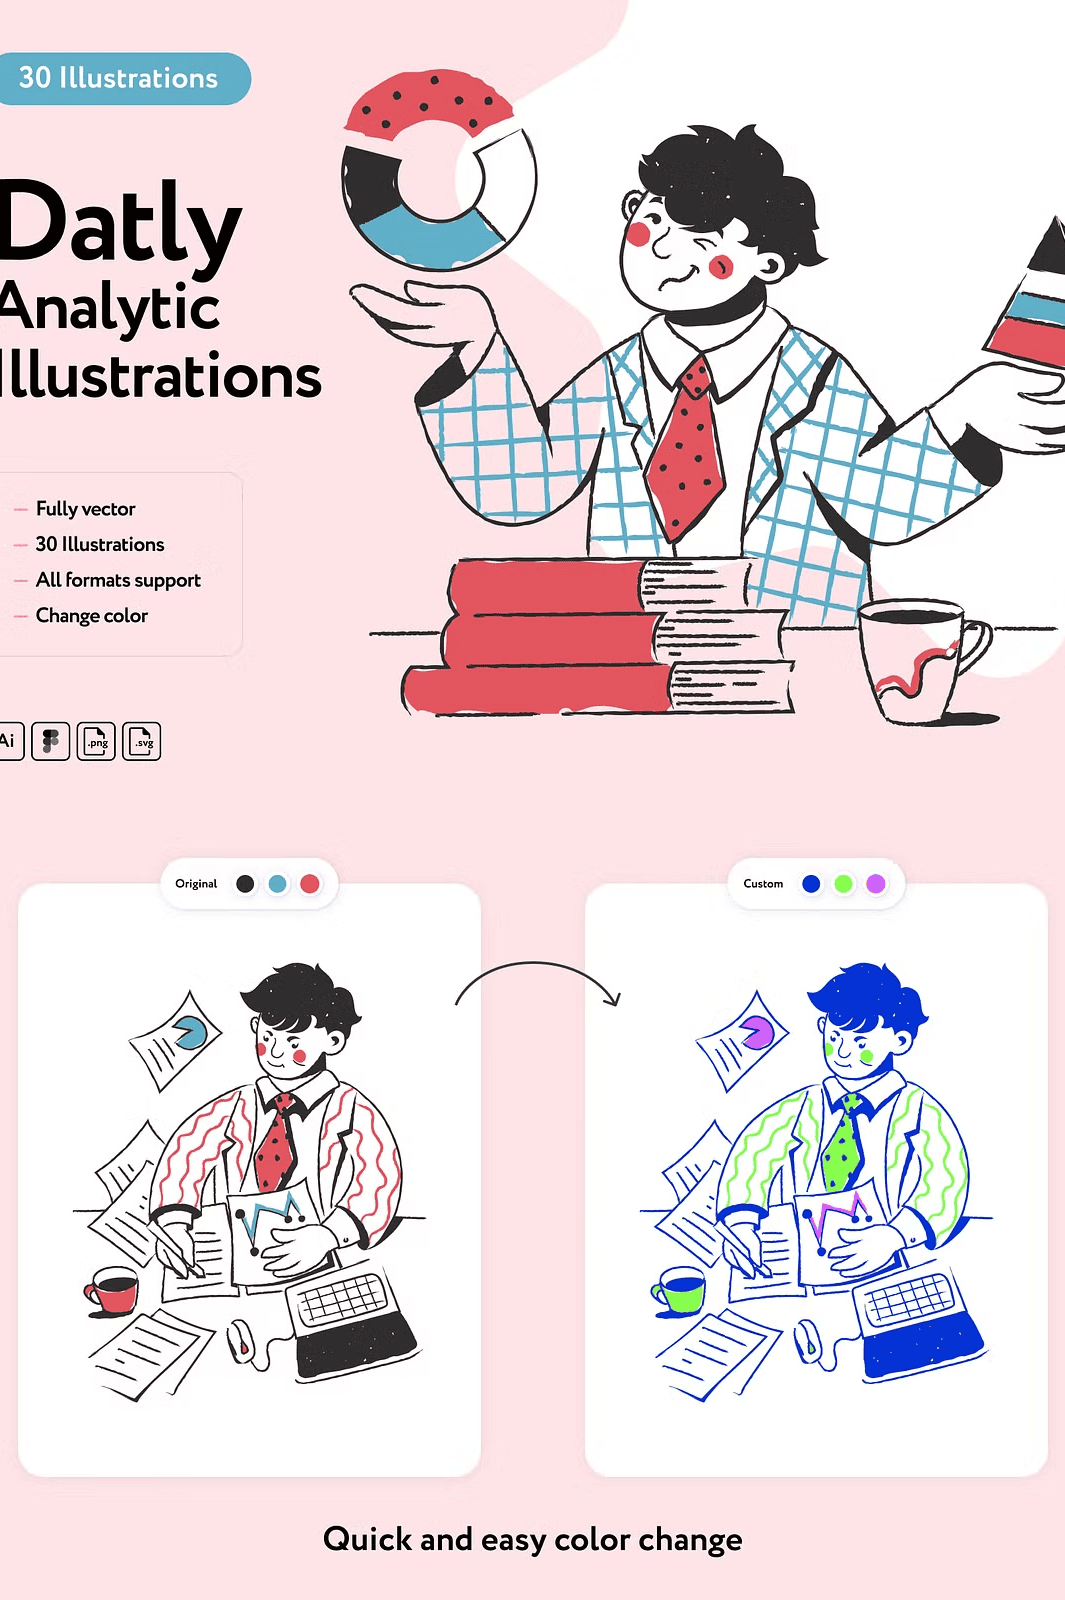
Every illustration in this set is **100% vector-based**, giving you complete control over color, scale, and customization. Whether you need to resize for a mobile screen, adjust to match your brand’s palette, or rework elements for a presentation, you’ll do it instantly—without losing quality. The files are expertly named and logically organized, so you can find exactly what you need in seconds.
Customize with ease:
– Change colors with one click
– Scale infinitely without pixelation
– Rearrange components to suit your layout
– Extract individual elements for reuse across multiple projects
No need to start from scratch. This toolkit is built for professionals who value speed, precision, and creative freedom.
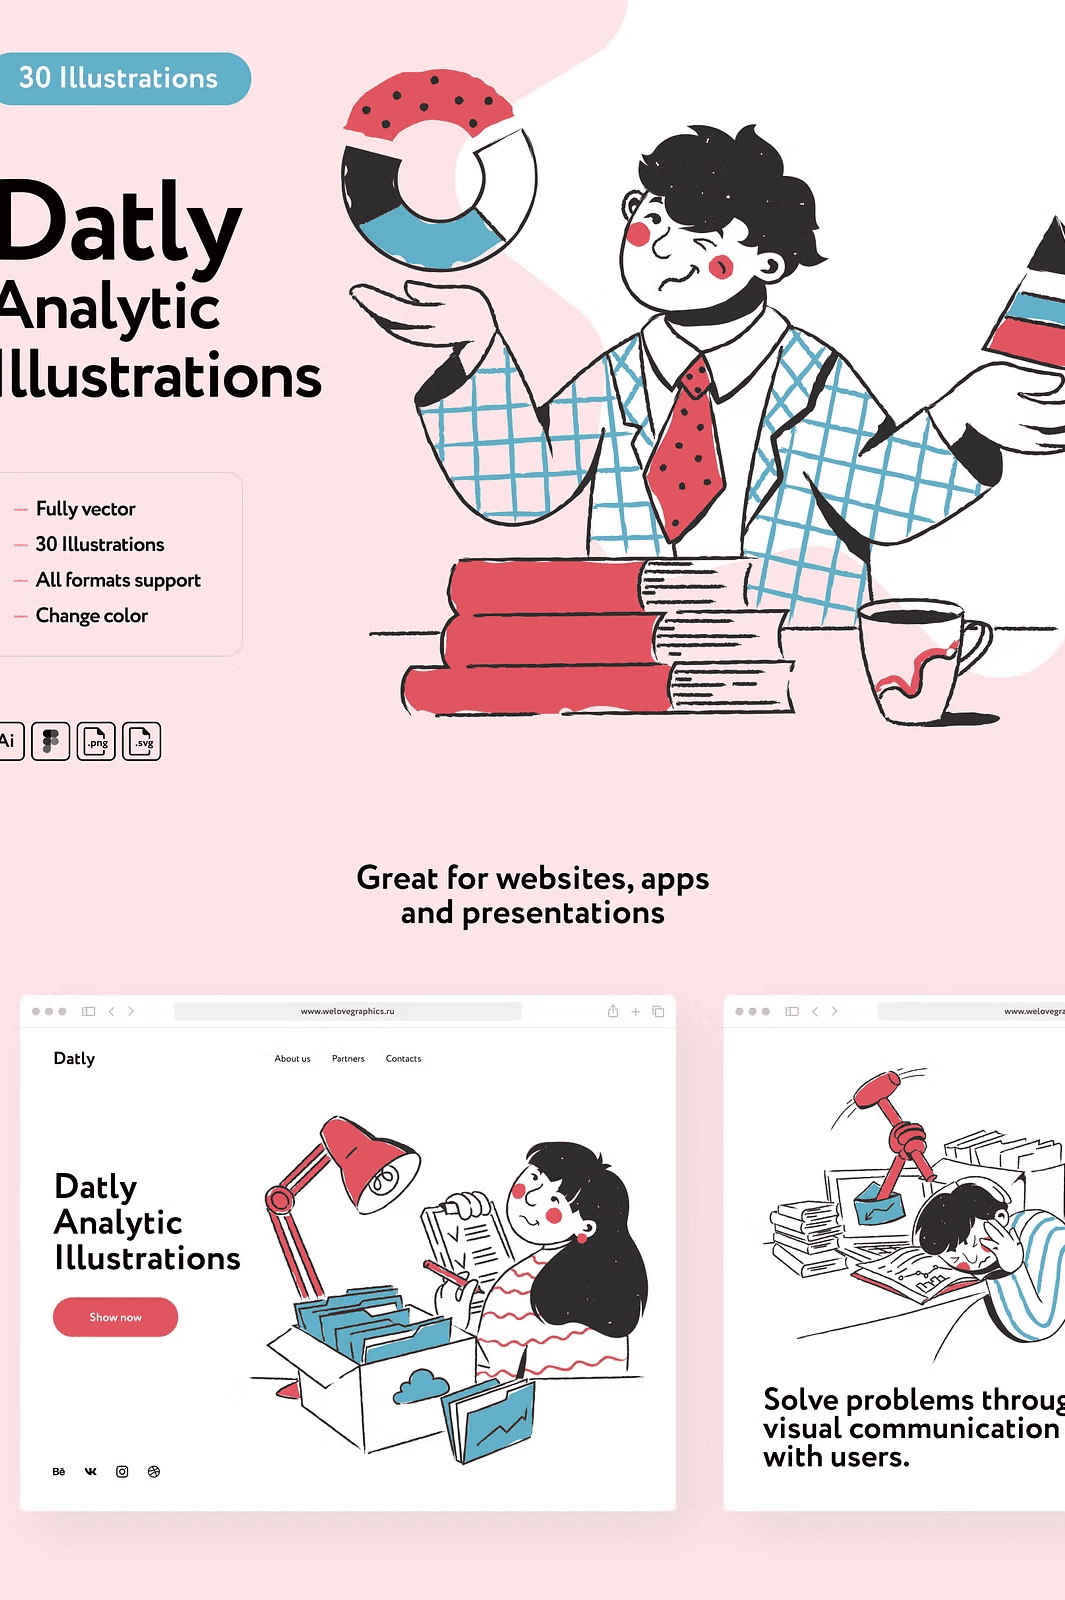
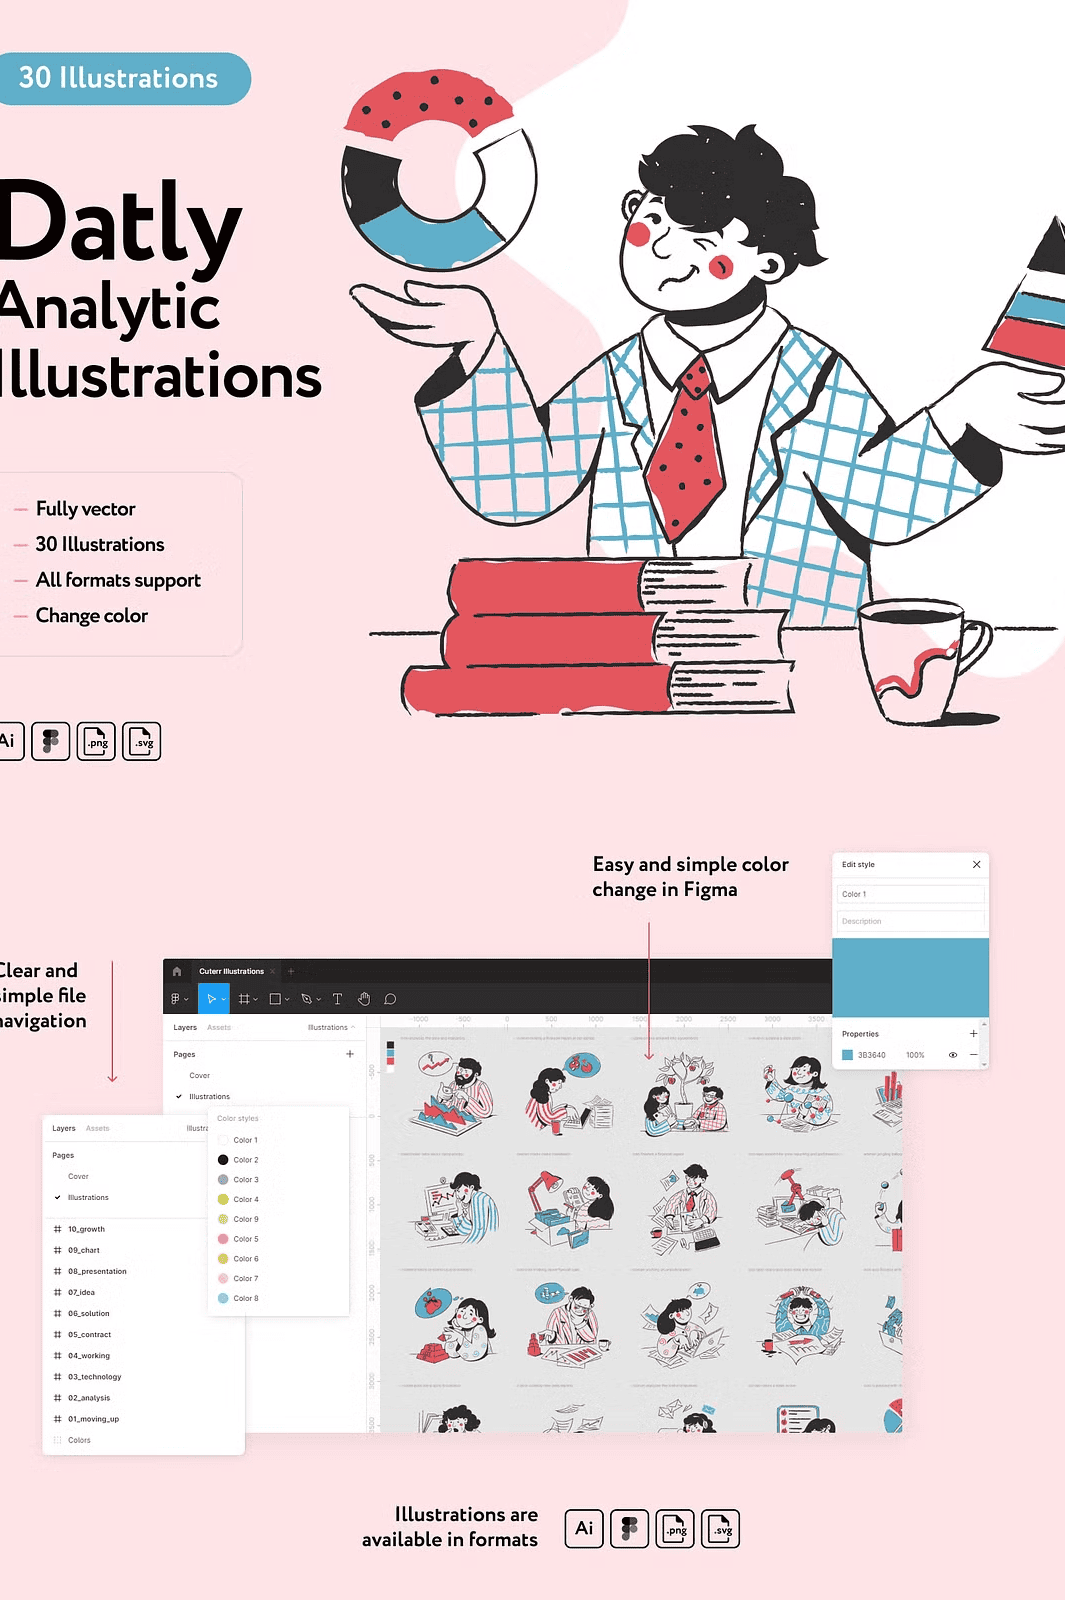
Seamless Integration Across Modern Design Platforms
Designed for today’s professional workflows, the set supports every major design and development environment:
– **Adobe Illustrator (AI):** Fully layered, editable paths with transparency support
– **Figma:** Ready-to-use components with live variables for rapid prototyping
– **SVG:** Lightweight, responsive files ideal for web integration and animations
– **High-Resolution PNG:** Transparent background files for quick UI placement and mockups
This multi-format compatibility means you can start designing immediately—no conversions, no delays. Use the same set for web, app, print, or presentation with consistent quality and performance.
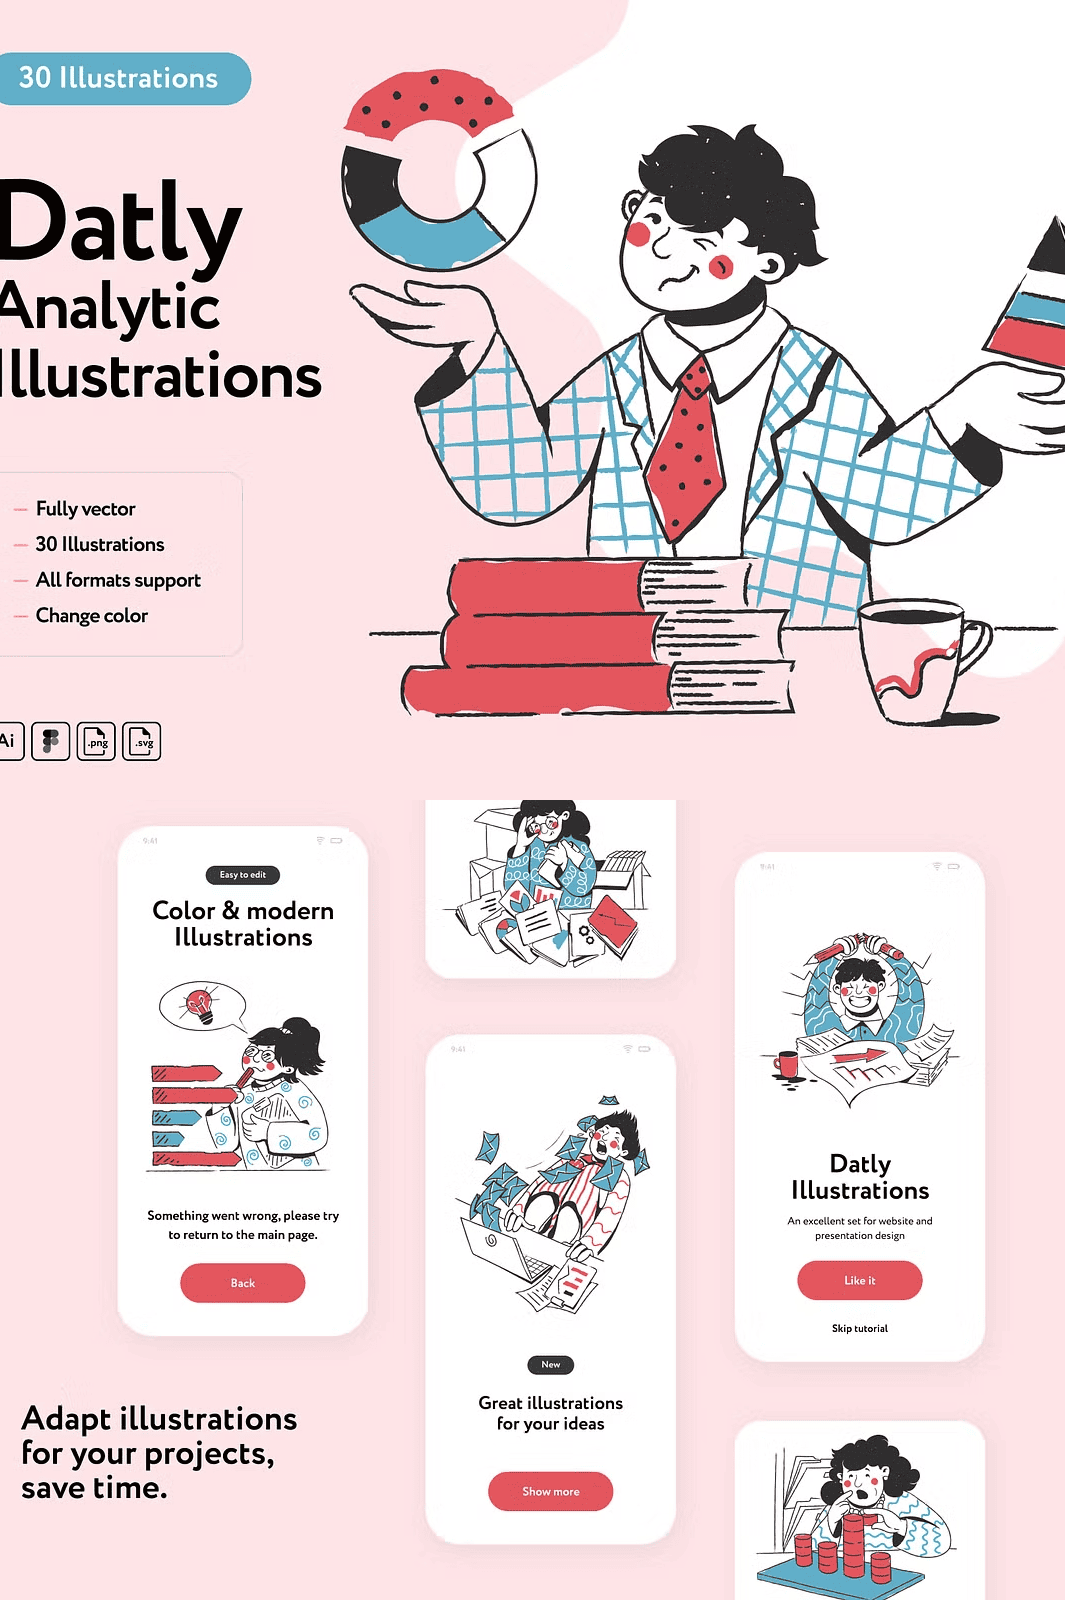
Speed Up Your Workflow with Intuitive, User-Centric Design
Each illustration is crafted with efficiency in mind. No overlapping layers. No hidden elements. Everything is optimized for fast editing and reuse. This is the ideal solution for agencies, freelancers, and in-house design teams working under tight deadlines.
Use these visuals to:
– Represent real-time data tracking and system alerts
– Depict analytics funnels, conversion rates, and user behavior
– Visualize business growth, market shifts, and digital transformation
– Break down abstract data concepts into memorable, relatable visuals
This isn’t just a collection—it’s a productivity upgrade for your design process.
Get Instant Access to a Premium Digital Design Asset
Stop wasting time searching for generic, low-quality clipart. This premium set delivers professional-grade visuals with immediate impact. With instant download and no subscription, you gain full rights to use these illustrations in commercial and personal projects.
This is part of the **”Retro Data Collection”** bundle—an expansive library of vintage-themed digital assets for modern creators. Save over 50% by upgrading to the full bundle and unlock thousands of design elements across multiple themes.
Bring your data to life with vibrant, retro-inspired visuals that stand out in any context. With 30 fully scalable and editable illustrations, you’ll transform how your audience engages with analytics. Download now and turn every data point into a story.


Leave a Comment