
Design Professional Business Infographics with Seamless Logic Flow
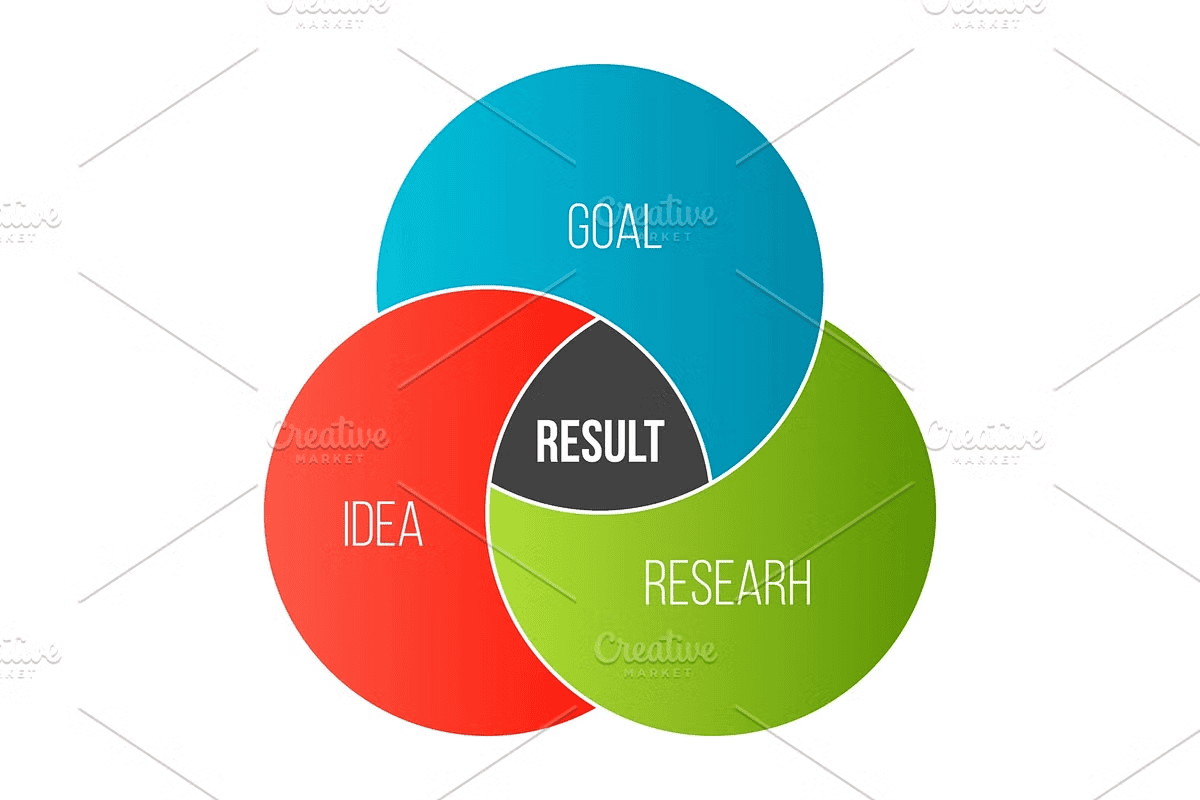
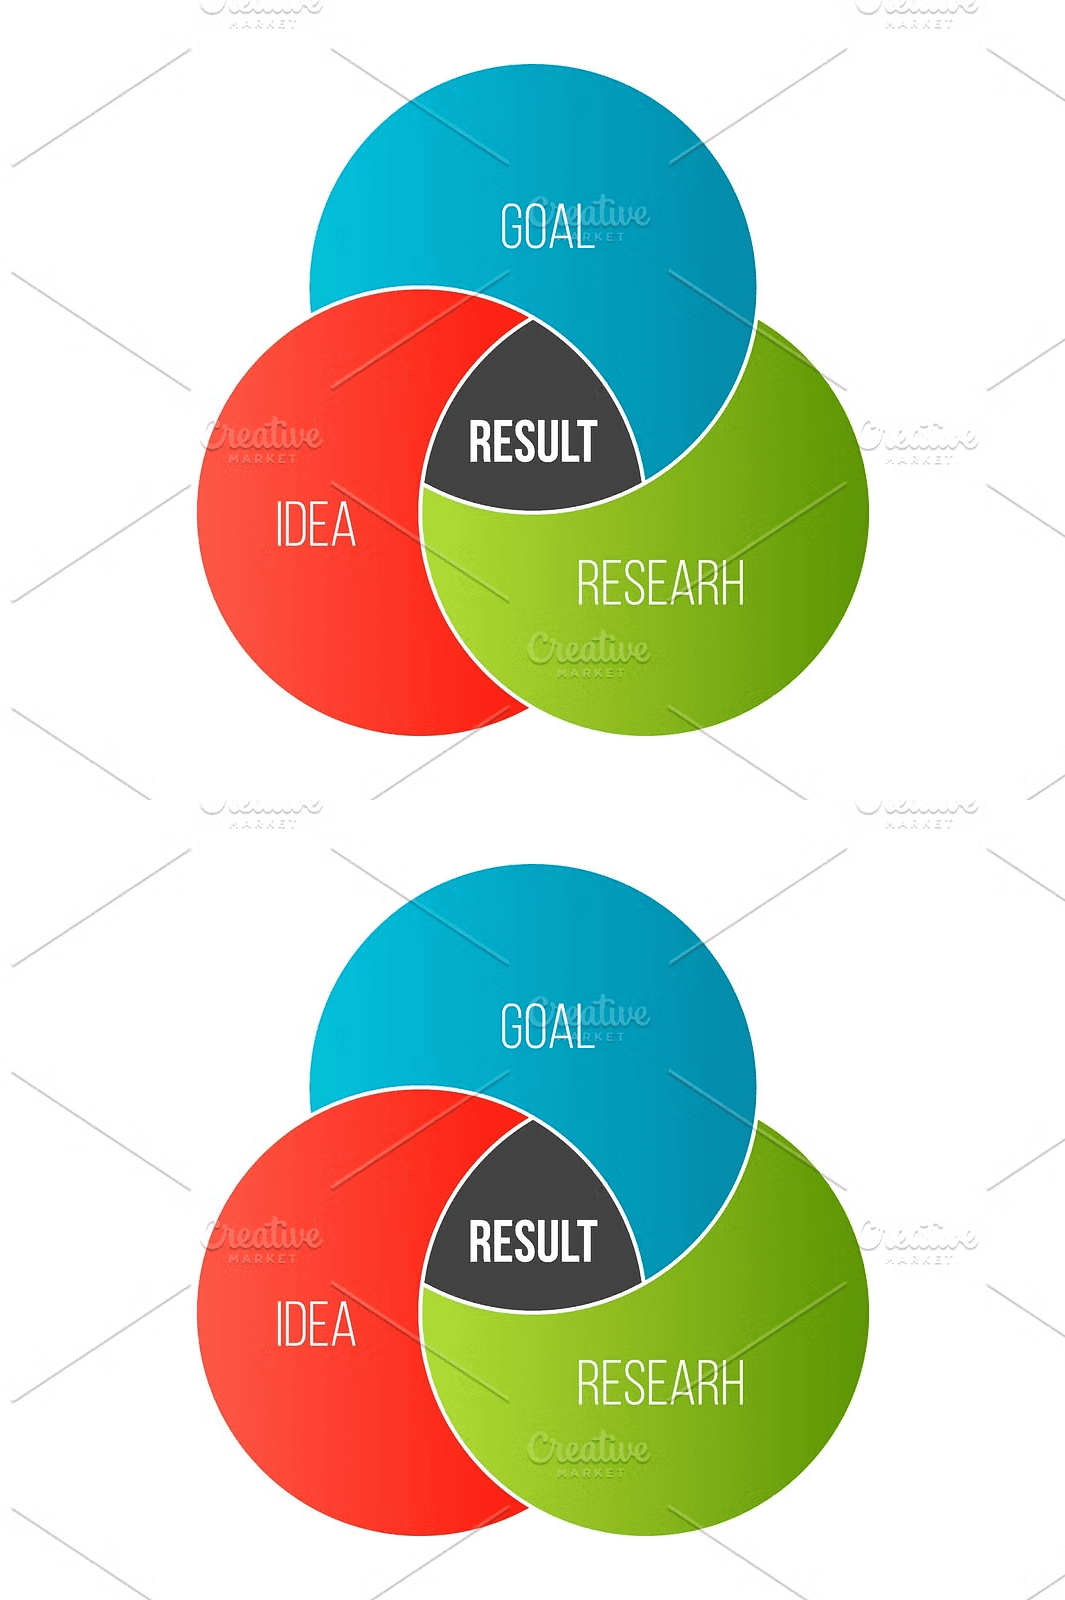
Transform complex ideas into clear, eye-catching visuals using this **creative vector illustration of a business presentation slide template** featuring a dynamic circle venn diagram. Expertly designed for modern presentations, this abstract concept graphic element excels in illustrating overlapping themes, shared attributes, market intersections, and team collaboration. Whether you’re a business strategist, educator, marketer, or freelance designer, this template gives you the tools to communicate nuanced relationships with simplicity and precision.
The design boasts clean, crisp lines and balanced spatial arrangement, ensuring each overlapping segment is clearly defined and mathematically proportional. Isolated on a transparent background, this vector graphic seamlessly integrates into any presentation style—PowerPoint, Google Slides, Figma, or Canva—without distracting elements. Use it to showcase synergy between departments, compare product features, map customer personas, or visualize competitive analysis.
Use It to Clarify Complex Data and Build Persuasive Narratives
Apply this versatile infographic element to:
– Illustrate market overlap in competitive positioning
– Present team collaboration dynamics in project management
– Compare product offerings in sales pitch decks
– Teach abstract thinking in classroom settings
– Represent customer journey stages with overlapping touchpoints
– Visualize data intersections in data-driven reports
This isn’t just a diagram—it’s a storytelling device. The ability to highlight shared zones and distinct areas helps audiences instantly grasp key insights and decision logic.
Editable Vector Files for Full Creative Control and Instant Use
Receive a fully customizable digital asset package in multiple high-quality formats for maximum compatibility:
– **AI (Adobe Illustrator)** – Layered, editable, supports advanced graphic manipulation
– **EPS** – Industry-standard file for print and cross-platform design
– **SVG** – Scalable vector for web, responsive design, and interactive applications
– **PNG** – Transparent background version for quick presentation use
– **JPG** – High-resolution raster file ideal for print and static displays
All files are vector-based, guaranteeing flawless clarity at any scale—zoom in, resize, or scale up to poster size with zero quality loss. No pixelation. No limitations.
Customize Every Detail to Match Your Brand Identity
Adjust colors, font styles, shapes, and line thicknesses in seconds to align with your brand guidelines. Change the background to match your presentation theme—neutral, bold, or gradient. Apply drop shadows or glows for more depth. Insert text labels directly into each segment. Reuse the same diagram across multiple slides with consistent formatting for a polished, professional look.
Ideal for:
– Creating branded pitch decks with unique visual identity
– Designing engaging social media content on business concepts
– Developing interactive learning modules for business courses
– Building templates for consulting firms and coaching services
Tailor every visual to speak directly to your audience.
Seamless Integration Across Design and Presentation Software
This template is built to work across your entire creative workflow:
– ✅ **Adobe Illustrator** – Full path editing and live anchor point control
– ✅ **Figma** – Responsive components with auto-layout compatibility
– ✅ **Sketch** – Organized layers and consistent symbol management
– ✅ **Google Slides & PowerPoint** – Import SVG or PNG for instant use
– ✅ **Web Development** – Embed SVG directly into React, HTML, or CSS projects
No conversion required. No compatibility hurdles. Just drag, drop, and design.
Download Now and Elevate Your Presentation Impact
Unlock instant access to this professional-grade infographic tool with **unlimited commercial use rights**. One-time purchase. No hidden fees. Perfect for designers, educators, entrepreneurs, and agencies.
Stop using generic clip art. Start building compelling visuals that communicate insight, strategy, and intelligence. Whether you’re analyzing market share, presenting a new business model, or teaching conceptual thinking, this **business circle venn diagram chart vector illustration** gives you the edge.
Transform abstract concepts into visual clarity. Empower your audience with powerful data storytelling. Download your circle venn diagram chart template today and design with confidence.


Leave a Comment