
Elevate Your Data Visualization with Sleek, Professional Design
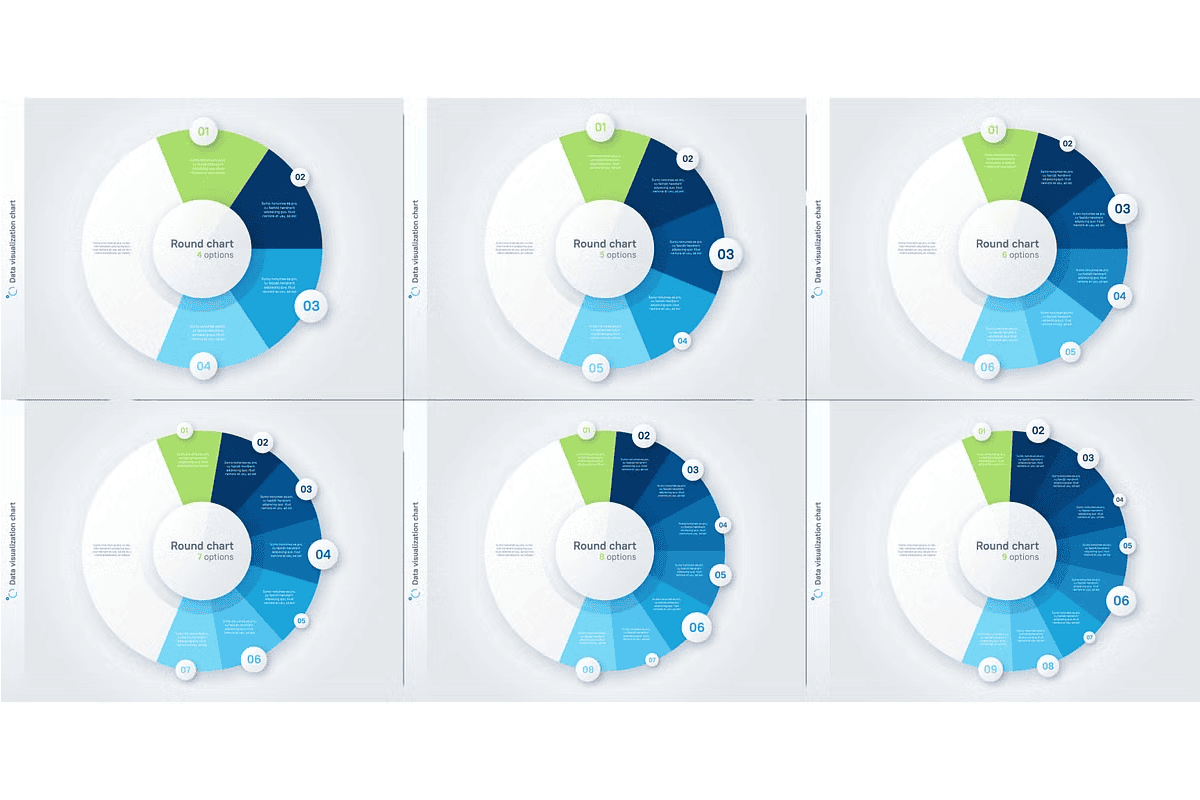
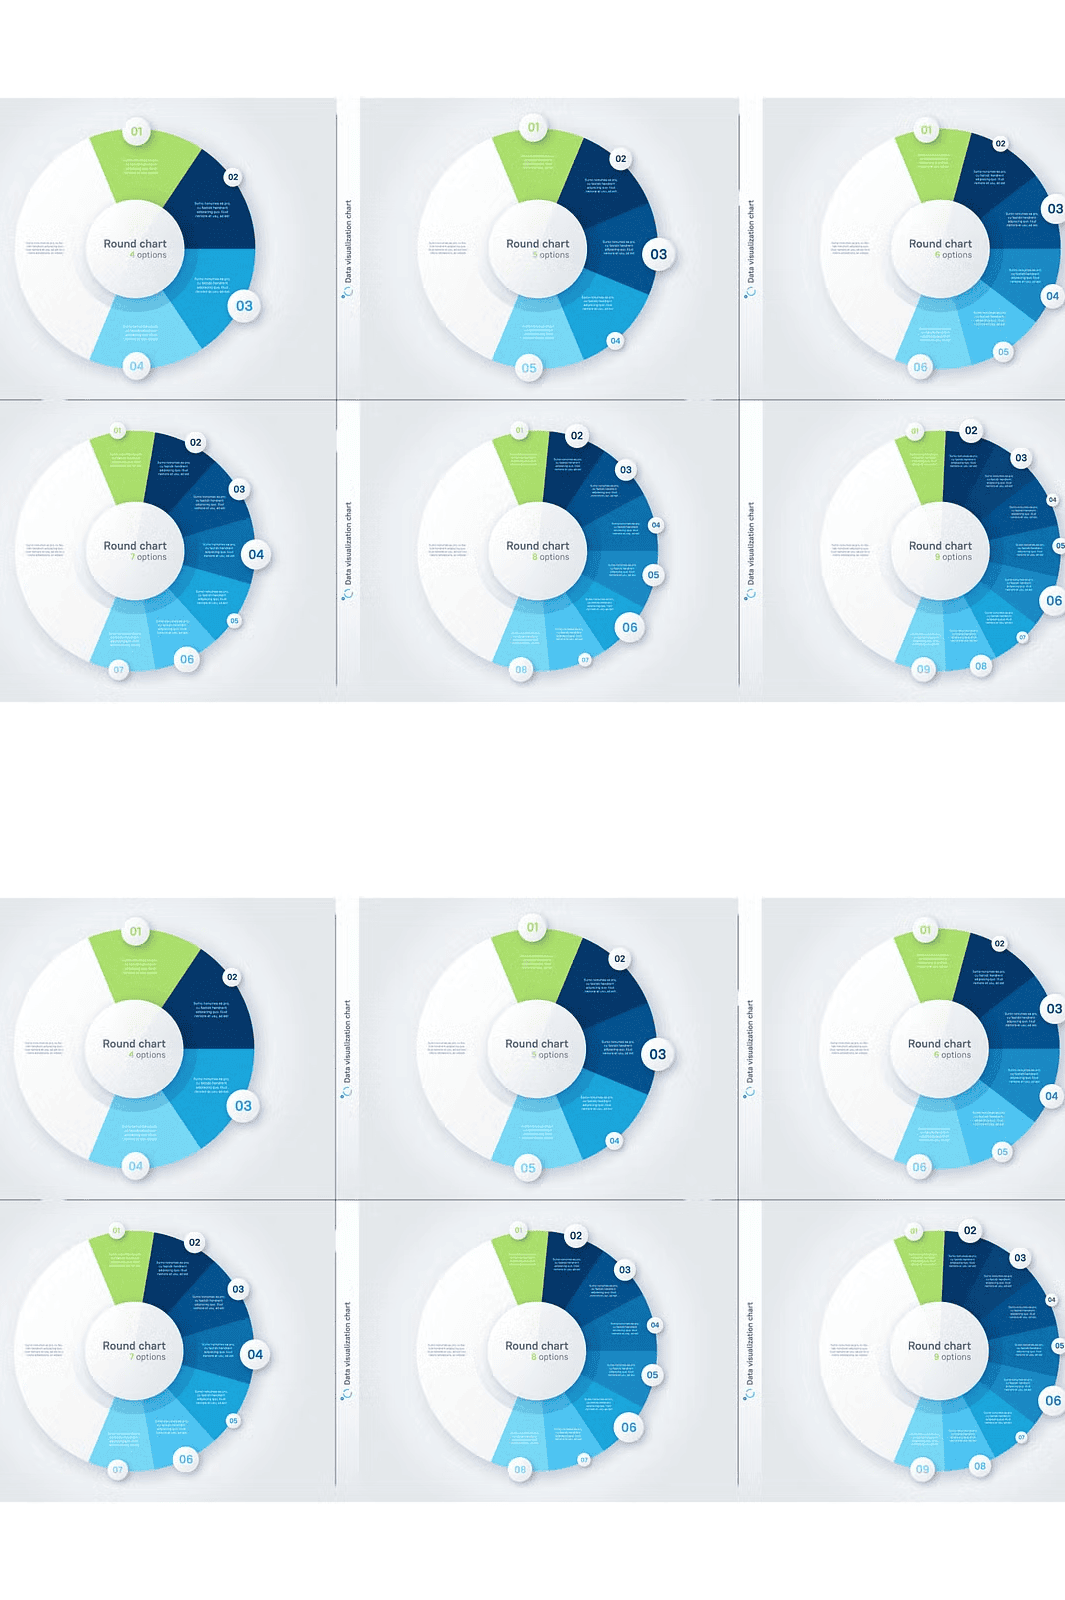
Transform your reports, presentations, and dashboards with this expertly crafted *Set of Vector Modern Circle Chart Infographic Templates*. Containing 4 to 9 distinct, ready-to-use design options, this collection delivers instant visual impact for any data-driven project. Each circle chart is precision-designed with clean lines, balanced layouts, and a modern aesthetic that ensures your data stands out with clarity and confidence.
Whether you’re presenting quarterly results, analyzing market share, visualizing project progress, or illustrating complex information, these dynamic templates make it easier than ever to communicate your message. The modular design ensures seamless integration into any workflow—without compromising professional quality.
Choose from 4 to 9 Versatile, Editable Circle Chart Styles
This collection offers a carefully curated selection of circle chart variations, including:
– **Donut Charts with Modern Color Schemes**
– **Split-Section Circles for Comparative Data**
– **Animated-Look Progress Charts (ideal for dashboards)**
– **Layered Ring Diagrams for Hierarchical Data**
– **Minimalist Designs with Subtle Shadows and Depth**
All templates are scalable vector files (SVG, AI, EPS) that maintain sharpness at any size, from mobile displays to large-format print. No pixelation, no quality loss—just professional-grade visuals you can trust.
Design with Confidence, Customize with Ease
These templates are not just beautiful—they’re built for real-world use. Every chart is fully editable, giving you complete control over:
– Color palettes (easily switch to match your brand)
– Data labels and text styling
– Chart ring thickness and spacing
– Animation effects (for digital presentations)
No design experience? No problem. The intuitive structure allows even non-designers to customize and update charts in minutes. Simply import the file into your favorite software—Adobe Illustrator, Photoshop, Figma, or CorelDRAW—and begin editing immediately.
Seamless Integration into Any Creative Workflow
Use these templates across a wide range of professional applications:
– **Business and Marketing Reports**: Visually highlight performance KPIs and market trends.
– **Slide Decks (PowerPoint, Google Slides)**: Create engaging, polished presentations that captivate your audience.
– **Website Content & Landing Pages**: Use them in blog posts, product features, or service overviews.
– **Dashboard UIs and Apps**: Enhance user interfaces with clear, intuitive data visuals.
– **Social Media Infographics**: Turn complex stats into digestible, shareable content for LinkedIn, Instagram, and Facebook.
Their clean, modern design ensures they never look outdated—making them a long-term investment in your visual toolkit.
Save Time and Impress Your Audience with Ready-to-Use Assets
Stop spending hours creating charts from scratch. This set empowers you to produce professional visuals in minutes, freeing up time for strategic thinking and creative work. Each design is optimized for fast workflow integration, allowing you to focus on insights, not formatting.
Perfect for freelancers, corporate teams, educators, and content creators who demand high-quality, efficient design tools.


Leave a Comment