
Elevate Your Data Storytelling with Professional-Grade Visuals
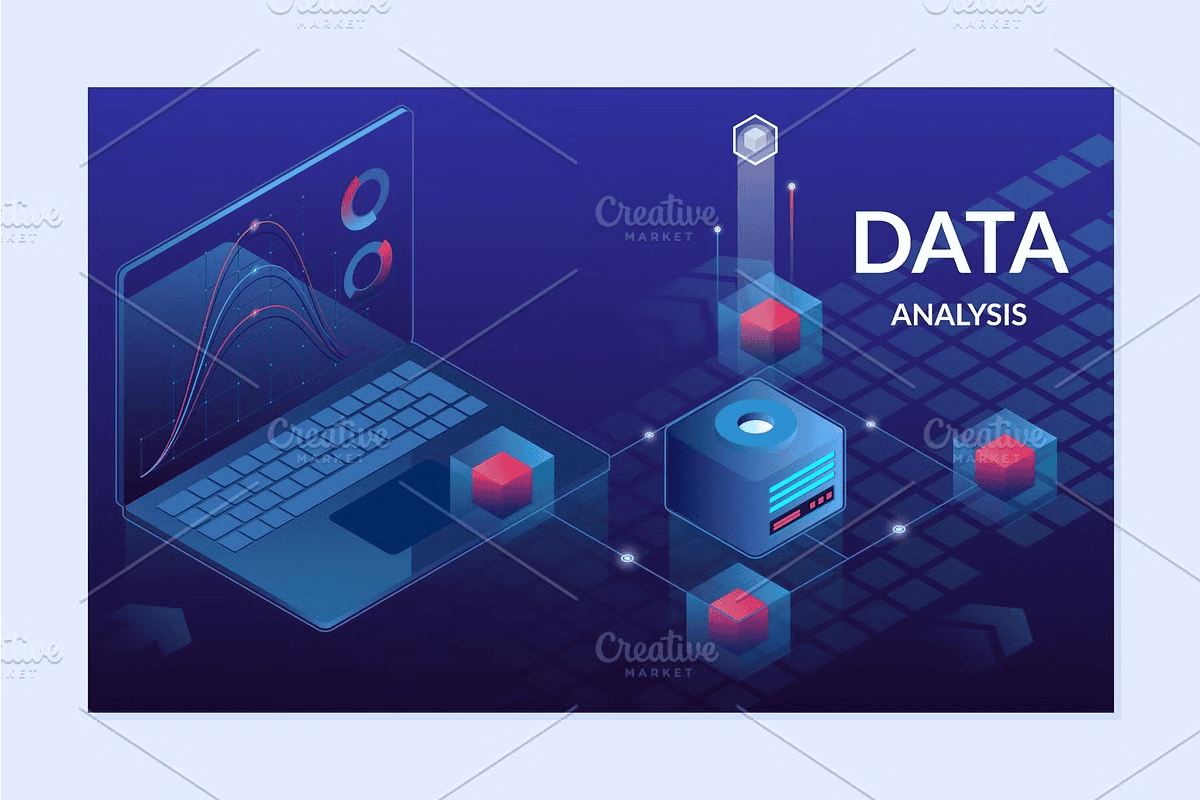
Transform your business presentations, landing pages, and reports with this powerful *Concept Business Analytics Template* featuring data financial graphs, interactive diagrams, and sleek digital visuals. Designed for entrepreneurs, marketers, analysts, and designers, this collection delivers high-impact, ready-to-use assets that communicate complex insights with clarity, style, and authority.
Whether you’re pitching to investors, launching a SaaS product, or building a corporate landing page, these visuals instantly convey professionalism, precision, and modernity. The template includes fully editable vector diagrams, graph charts, dashboard mockups, and conceptual illustrations that are optimized for web, print, and digital media.
Build High-Impact Landing Pages with Dynamic Visual Assets
Stop using generic stock graphics that lack context and depth. This template provides context-rich, concept-driven visuals that go beyond basic charts. It features:
– **Interactive Financial Graphs**: Realistic line, bar, and pie charts showing growth, trends, and market performance.
– **Dashboard UI Mockups**: Pre-designed layouts for business analytics platforms, data dashboards, and performance trackers.
– **Conceptual Data Flow Diagrams**: Visualize data pipelines, customer journeys, and digital workflows with clean, modern design.
– **Business Strategy Infographics**: Illustrate key metrics, KPIs, and business models in ways that engage and inform.
– **Vector-Editable Files**: All elements are scalable, color-customizable, and fully editable in Adobe Illustrator, Figma, or any vector design software.
Every component is precision-crafted to maintain consistency in style and visual hierarchy, ensuring your final design looks polished and cohesive.
Seamlessly Integrate into Your Creative Workflow
This template is not just a collection of images—it’s a strategic toolkit engineered for speed, adaptability, and impact. The layered vector structure allows you to modify colors, update numbers, reposition elements, and scale to any size without quality loss. This adaptability makes it ideal for:
– **Landing Page Design**: Create high-converting website visuals that showcase your product’s data-driven potential.
– **Investor Pitch Decks**: Present business growth, financial health, and market expansion with compelling, real-time-ready graphs.
– **Internal Reports & Dashboards**: Quickly generate professional reports for executives, teams, or stakeholders.
– **SaaS & App Marketing**: Use the diagrams to demonstrate platform capabilities, data processing, and user engagement.
– **Presentation Slides & Webinars**: Deliver confident, visually-driven talks that captivate audiences.
Maximize ROI with a Future-Ready Template
Unlike static image bundles, this template is built for evolution. You’re not just downloading a set of graphics—you’re investing in a reusable, versatile design system. The files are organized with smart naming, grouped layers, and minimal clutter, so you can launch your project faster and deliver better results.
All files are delivered in high-resolution formats including SVG, EPS, and PNG, ensuring compatibility across platforms and software. Whether you’re working on a tight deadline or crafting a long-term content strategy, this template adapts to your needs with ease.
Take Your Business Visuals to the Next Level Today
Ready to go beyond basic charts and generic templates? This *Business Analytics Concept Template* gives you the tools to stand out in a crowded digital space.
From concept to execution, every visual is designed to inspire confidence, drive engagement, and deliver measurable impact. It’s not just a set of diagrams—it’s your competitive advantage.


Leave a Comment