
Elevate Your Presentations with High-Impact Infographic Templates
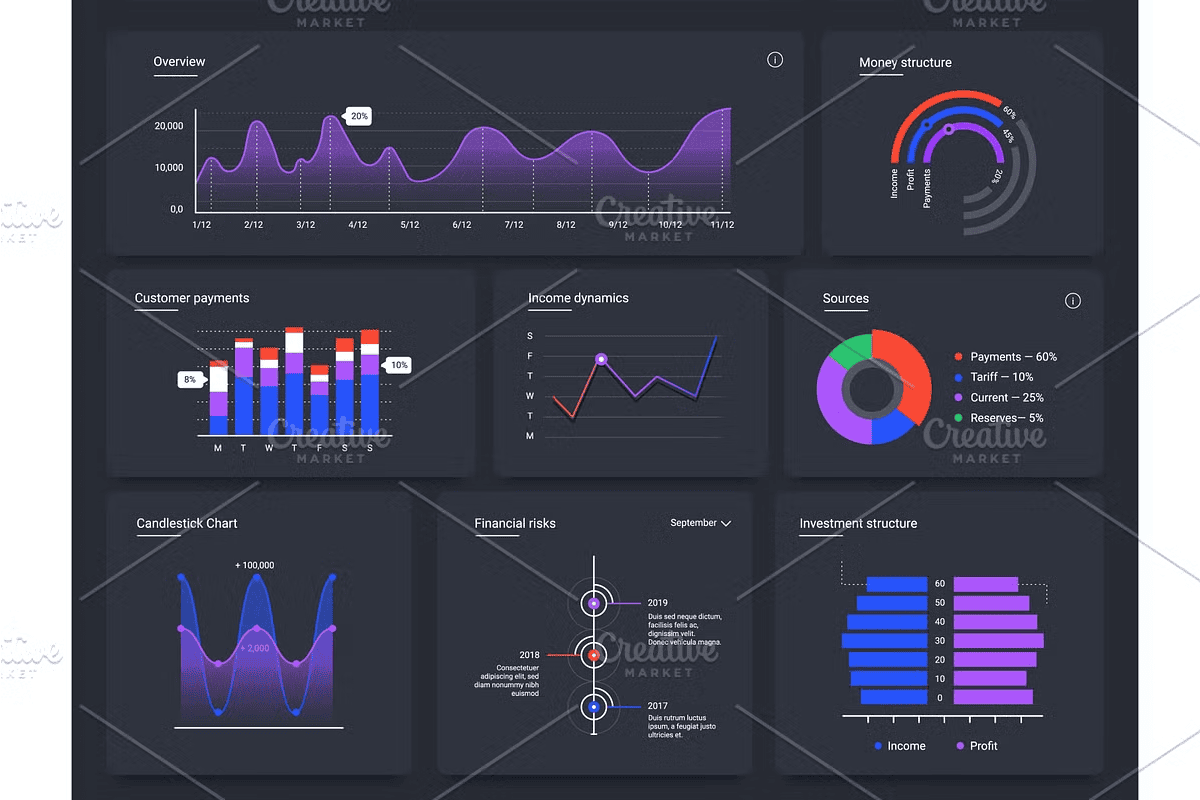
Unlock the full potential of your data with this **comprehensive, professionally designed vector template** for dashboard charts, data graphics, and statistic chart diagrams. Engineered for maximum clarity and visual impact, this collection delivers powerful sales analysis visualization and investment monitoring tools, all wrapped in a sleek, modern aesthetic with a bold black background that makes every element pop.
Designed for digital creators, analysts, marketers, and business strategists, these vector graphics are not just templates—they’re **action-oriented tools** that let you present complex data with precision, confidence, and style. Whether you’re preparing a quarterly report, a pitch deck, or a client dashboard, this set provides everything you need to turn numbers into narratives that engage and persuade.
Seamless Integration into Web and UI Design Projects
This asset is built for real-world use across multiple platforms and workflows:
– **Scalable vector formats (AI, EPS, SVG, PDF)** – perfect for web, app, and print with zero loss of quality
– **Fully editable layers** – customize colors, labels, and chart types with ease in any design software
– **Clean, consistent UI style** – ideal for dashboards, reports, landing pages, and digital analytics platforms
– **Black background design** – ensures maximum contrast and readability across screens and presentations
No more struggling with pixelated images or locked layers. This template is built from the ground up for designers who demand flexibility, speed, and polish.
Create Compelling Sales Analysis and Investment Monitoring Visuals
Stop leaving your data’s story untold. This template equips you with **ready-to-use chart types** that visualize key performance indicators, revenue growth, market trends, and investment performance—perfect for:
– Sales team performance dashboards
– Investor pitch decks and quarterly reviews
– Financial reports and business planning tools
– UI/UX mockups for fintech apps and SaaS platforms
Each chart is designed to be intuitive and impactful, using visual hierarchy, clear labels, and dynamic layouts that guide the viewer’s eye from insight to action.
Professional-Grade Infographics at Your Fingertips
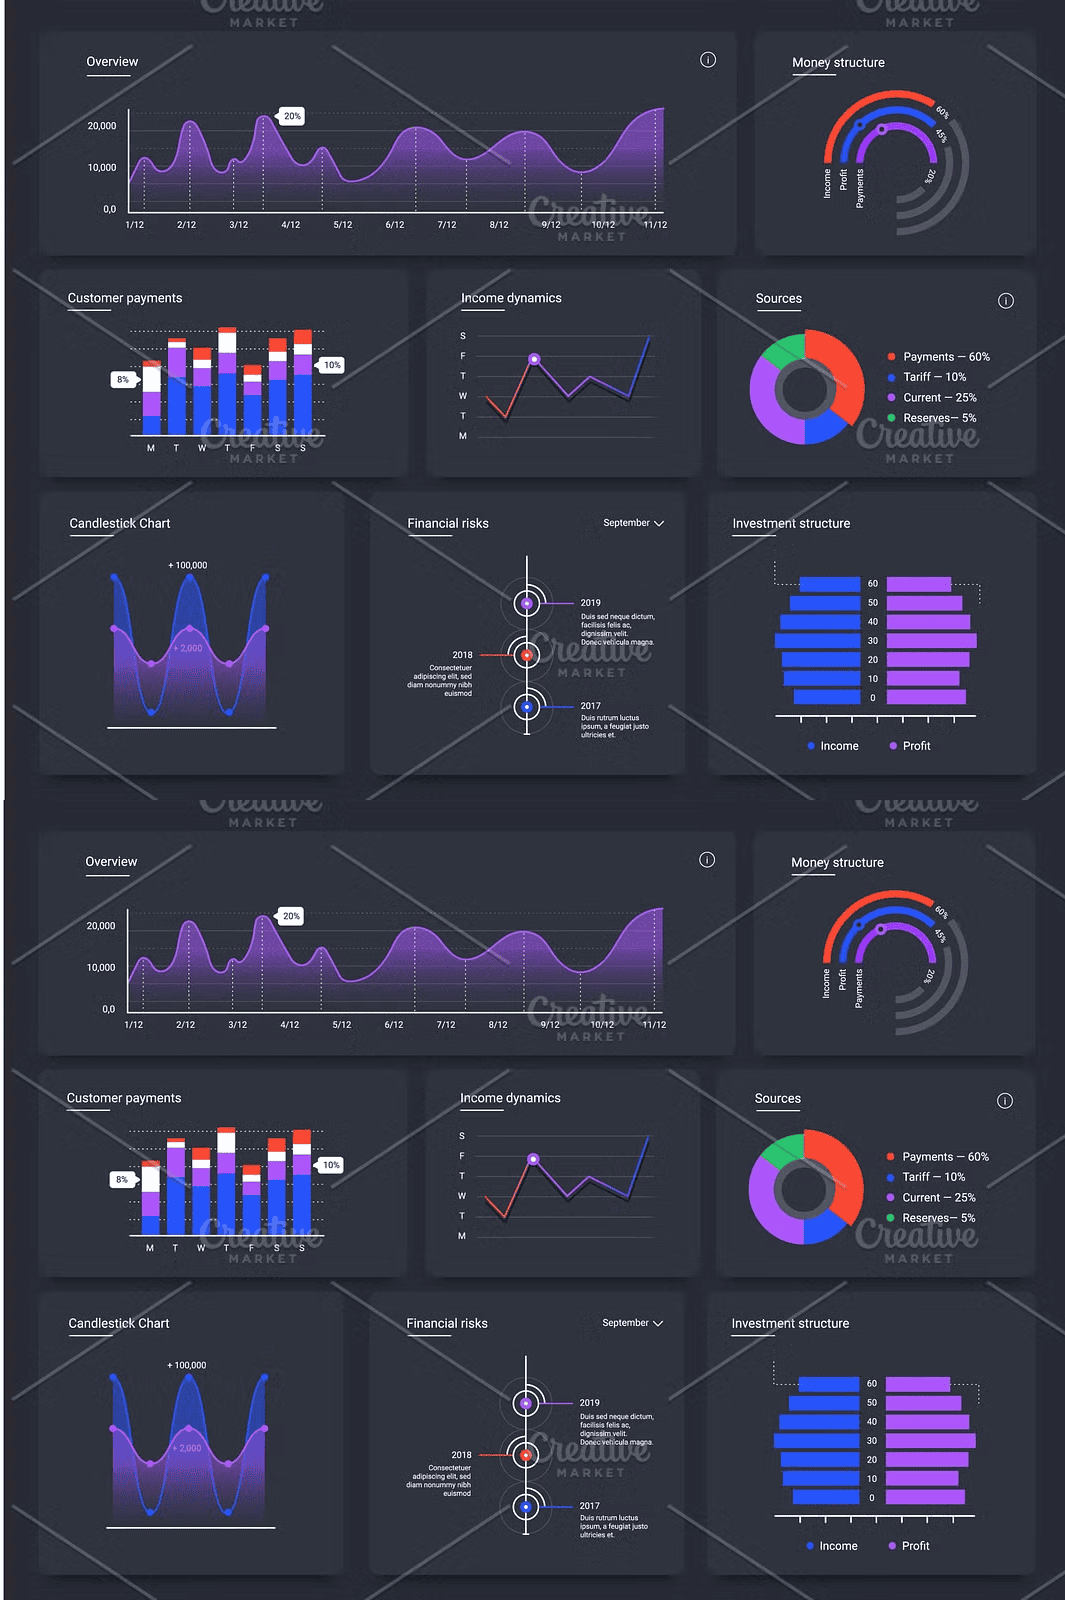
From bar and line graphs to pie charts, progress bars, and data cards, this collection provides complete visual solutions:
– **Customizable data points** – update numbers, labels, and themes instantly
– **Consistent design system** – ensures visual harmony across multiple charts
– **Highly detailed components** – includes icons, badges, time indicators, and callout boxes
– **Export-ready for web and print** – ready for branding, social media, and client presentations
Whether you’re visualizing monthly sales growth, tracking campaign performance, or monitoring stock portfolios, this template gives you the visual language to communicate with authority.
Boost Efficiency and Design Quality with Pre-Built Templates
Time is precious. This bundle saves you hours of design effort by offering **pre-structured, clean, and professional templates** that you can deploy immediately. No more starting from scratch. Just plug in your data, adjust the visuals, and deliver stunning results—on time, every time.
Ideal for:
– Marketing teams creating campaign performance reports
– Consultants presenting data-driven strategies
– Educators teaching data visualization concepts
– Freelancers delivering polished client work
The consistency and elegance of these designs instantly elevate your professional image and prove your attention to detail.
Future-Proof Your Design Workflow
Built with scalability and adaptability in mind, this vector set adapts to any project size or platform—from mobile app icons to giant presentation screens. Use it to:
– Update and refresh existing dashboards without redesigning from scratch
– Build modular templates that can be reused across departments
– Collaborate efficiently with teams using shared design systems
– Maintain brand consistency across all visual outputs
This isn’t just a collection of charts—it’s a **design system in motion**, empowering you to build smarter, faster, and more impactful visual content.
Download Your Professional Dashboard Toolkit Today
Why spend days building charts from scratch when you can download this premium vector set and start designing immediately?
Empower your data storytelling with tools that are as powerful as your insights.
Click the button above to access instant, unlimited download rights and begin transforming your data into visually stunning, professional-grade infographics. Make your numbers speak louder than ever.


Leave a Comment